


Where this post comes from. This article is based on our own notes from using the Fund Performance page of the Association of Mutual Funds in India (AMFI). The description of AMFI draws on a Kotak Neo explainer. The fund categories follow SEBI’s circular of 26 February 2026. The Direct and Regular plan explanation draws on Kotak Mutual Fund, and the benchmark rule on a Business Standard (PTI) report of SEBI’s January 2018 directive. All are listed at the end.
Anyone who wants to invest in a mutual fund soon runs into the same questions. Which fund is better? Which one has a good track record? How can I see what has done well in the past? The answer turns out to be simple, and it is free. The industry publishes the data, and anyone can look at it. This guide shows how to analyze a mutual fund step by step, using only free data.
How to analyze a mutual fund: where to look on the AMFI website
AMFI is a non-profit, self-regulatory body that represents the asset management companies (AMCs) that run mutual funds in India. It was set up in 1995. Among other things, it collects and publishes industry data, including the performance of funds.
It is easy to mix up AMFI and SEBI. SEBI is the statutory regulator. It makes and enforces the rules for the whole securities market. AMFI is an industry body. It helps put SEBI’s guidelines into practice and sets standards for how the mutual fund business operates, but it does not have SEBI’s legal powers. The distributors you meet also come into the picture here. They hold an AMFI Registration Number (ARN), which they receive after passing a certification exam.
To see the data, visit the Fund Performance page: https://www.amfiindia.com/otherdata/fund-performance
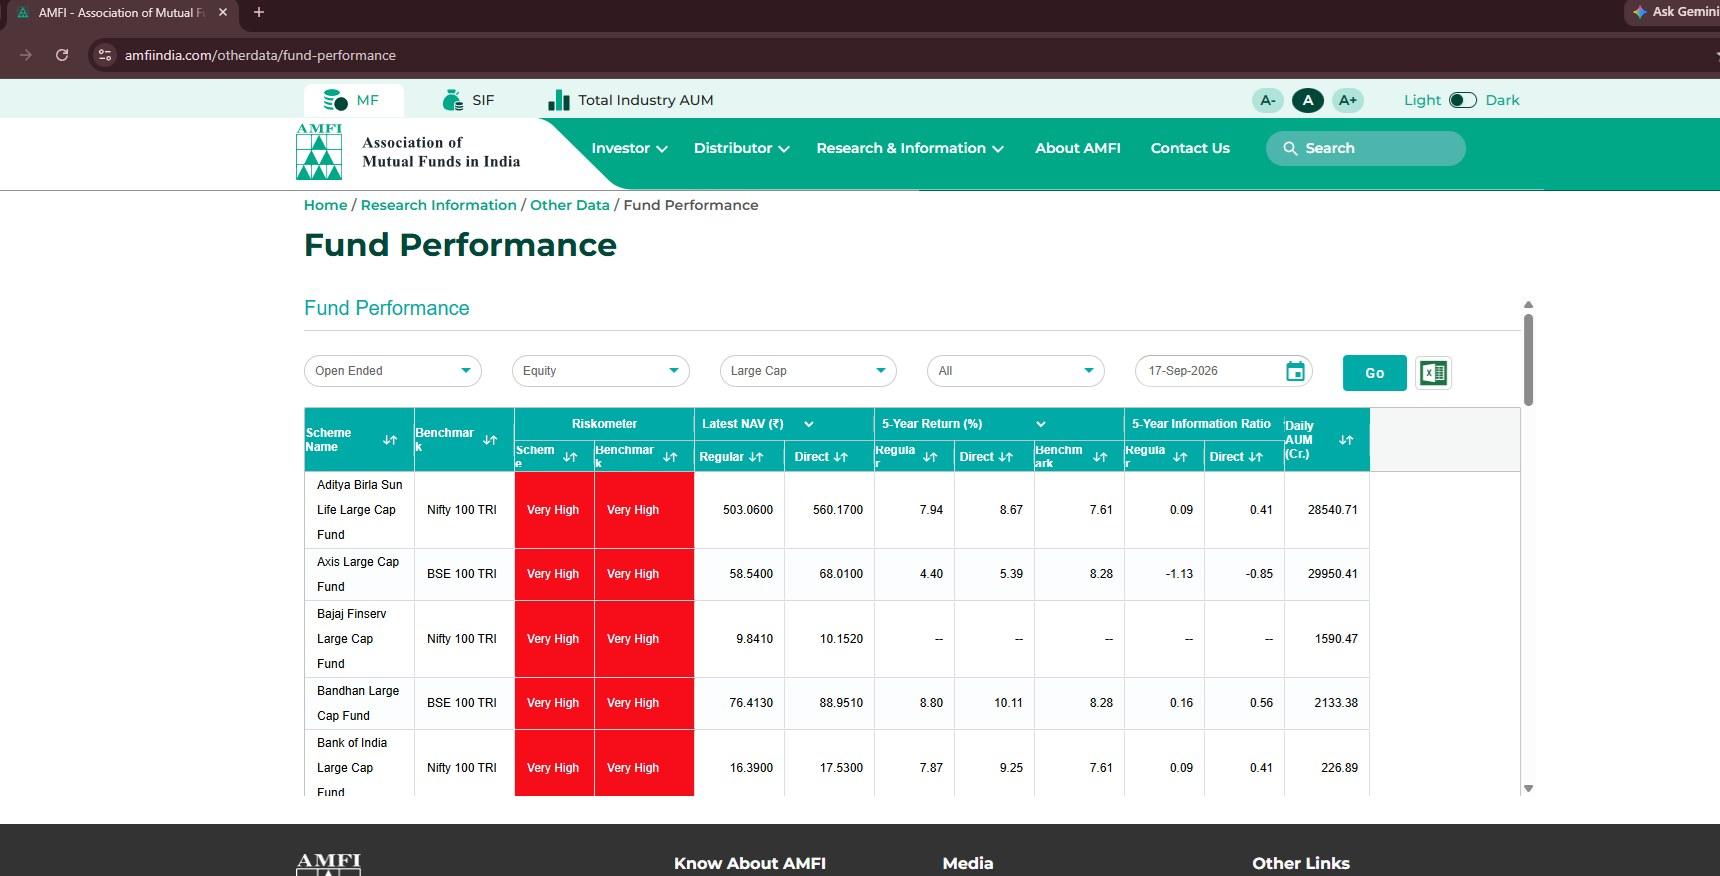
Pick the type of scheme, the segment (for example, Equity), the category (for example, Large Cap) and a date, then click Go. The table then lists every fund in that category, with its benchmark, riskometer rating, latest NAV, returns and size.
The equity categories, in plain words
Under the Equity segment, funds are sorted into categories set by SEBI. Each category has a rule on where the fund must invest, so you know what kind of fund you are looking at before you look at its returns. Companies are ranked by market capitalization, which is the total value of their shares. SEBI revised these categories on 26 February 2026. Many older guides still show the earlier rules, so the figures below follow the new circular.
By company size
Large Cap Fund. At least 80% of assets in large-cap companies, which are the top 100 by market capitalization.
Large & Mid Cap Fund. At least 35% in large-cap stocks and at least 35% in mid-cap stocks.
Mid Cap Fund. At least 65% in mid-cap stocks, which are companies ranked 101st to 250th.
Small Cap Fund. At least 65% in small-cap stocks, which are companies ranked 251st and below.
Across all sizes
Multi Cap Fund. At least 75% in equities, with at least 25% each in large-cap, mid-cap and small-cap stocks.
Flexi Cap Fund. At least 65% in equities across large, mid and small companies. The fund manager is free to shift between them as opportunities change.
By investment style
Value Fund. At least 80% in equities, following a value strategy. It looks for stocks that seem undervalued compared with what the company is really worth.
Contra Fund. At least 80% in equities, following a contrarian strategy. It buys stocks or sectors that are out of favor and are expected to recover. Under the 2026 rules, a fund house may offer both a Value fund and a Contra fund, as long as their portfolios overlap by no more than 50%.
Dividend Yield Fund. At least 80% in stocks that pay dividends.
Focused Fund. A concentrated portfolio of no more than 30 stocks, with at least 80% in equities.
By sector, theme or tax saving
Sectoral Fund. At least 80% in one sector, such as banking or pharmaceuticals.
Thematic Fund. At least 80% in one broader theme, such as infrastructure or consumption. Sectoral and Thematic are now two separate categories.
ELSS (Equity Linked Savings Scheme). A tax-saving fund that invests at least 80% in equities. It has a mandatory 3-year lock-in period and offers a tax deduction under the old tax regime.
Regular or Direct?
Look again at the table and you will see two columns for NAV and returns, one for Regular and one for Direct. Both plans invest in the same portfolio, with the same fund manager. The difference is the cost.
In a Regular plan, you invest through an intermediary such as a broker, financial advisor or bank. The fund company pays the intermediary a commission and recovers it by charging the fund a higher annual fee, called the expense ratio. That slightly reduces your returns.
In a Direct plan, you invest straight with the fund company, or through a platform that offers only direct plans. No commission is paid, so the expense ratio is lower. More of your money stays invested, which leads to slightly higher returns and a higher NAV over time.
Some people prefer Direct plans to avoid paying a commission. Others prefer to have someone guide them. It is a personal choice. Distributors help you invest and give you information about products, but they do not provide investment advice unless they are separately registered with SEBI as an investment adviser. Whichever way you lean, you can check for yourself. Compare the two plans over different time periods, try different amounts of money, and see whether the difference matters for you. Both kinds of investors, the ones who like advice and the ones who like to do it themselves, can use the same data.
How to analyze a mutual fund’s performance over different time periods
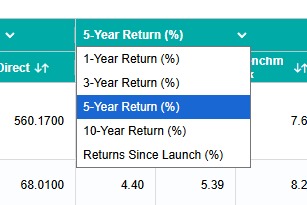
A fund that did well last year may not have done well over five years. The page lets you compare returns over five different periods: 1 year, 3 years, 5 years, 10 years and since the fund was launched. Use the dropdown at the top of the returns column to switch between them. Looking at more than one period gives a fuller picture than any single number.
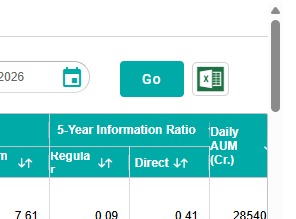
You can also download the data in Excel format. Click the green Excel icon next to the Go button and the table is saved as a spreadsheet. Once you have it, you can sort it, chart it and compare funds in ways the table itself does not offer. It is a good way to go beyond a simple ranking and see the numbers for yourself.
How to analyze a mutual fund fairly: don’t skip the benchmark
A benchmark is a standard index, such as the Nifty 50 or the BSE 100, used to measure how a fund is doing. It is the reference point for judging how well the fund manager is doing the job. It is used in four ways.
To measure relative performance. A fund’s return of 12% means little on its own. If the benchmark returned 15% over the same period, the fund fell behind. If the benchmark returned 9%, the fund did better, which suggests the manager added value. That extra return is often called “alpha”.
To judge risk. A fund may beat its benchmark by only a little while swinging up and down far more. In that case, its return for the risk taken is poor. The riskometer column in the table shows a rating for both the fund and its benchmark.
To understand the strategy. A fund that uses the Nifty Midcap 150 as its benchmark is telling you it mainly invests in mid-sized companies. That helps set the right expectations.
To get a fair comparison. In January 2018, SEBI directed that fund performance be measured against the Total Return variant of an index. This is why you see names like “Nifty 100 TRI” in the table. A Total Return Index (TRI) counts both the price gains of the stocks and the dividends they pay. A Price Return Index counts only the price gains, so it can make a fund look better than it is.
The bottom line: how to analyse a mutual fund in a few minutes
The data you need is already public and free, so you know how to analyze a mutual fund without paying for anything. Start with the category that matches your goal, compare Regular and Direct if cost matters to you, look at more than one time period, and always measure a fund against its benchmark. Remember that past performance does not guarantee future returns. It is one input to your decision, not the whole answer.
A tip for AI enthusiasts
If you use an AI assistant such as Claude, you can make this job easier. Download the Excel sheets for the categories you care about and ask it to summarize them and turn them into charts. It can help you see patterns quickly. As always, check the numbers against the source.
This post is based on the reports and public pages listed below, for information only. It is not investment advice, and we are not recommending any fund or plan. Rules and figures are as reported by these sources and may change. Any mistakes in summarising them are ours.
Key takeaways
- Where to look: AMFI’s Fund Performance page lists every fund in a category with its benchmark, riskometer rating, latest NAV, returns and size, for free, with an Excel download. AMFI is a non-profit industry body, while SEBI is the statutory regulator.
- How to analyze a mutual fund: Compare Regular and Direct plans, which hold the same portfolio at a different cost. Look at returns over 1, 3, 5 and 10 years and since launch, and measure the fund against its benchmark, which is a Total Return Index.
- Keep in mind: Past performance does not guarantee future returns. The article calls this data one input to a decision, not the whole answer, and it does not recommend any fund or plan.
Frequently asked questions
AMFI, the Association of Mutual Funds in India, is a non-profit, self-regulatory body set up in 1995 that represents the asset management companies running mutual funds. SEBI is the statutory regulator that makes and enforces the rules for the whole securities market. AMFI helps put SEBI’s guidelines into practice but does not have SEBI’s legal powers.
Visit the Fund Performance page on the AMFI website, pick the type of scheme, the segment, the category and a date, then click Go. The table lists every fund in that category with its benchmark, riskometer rating, latest NAV, returns and size. You can switch returns between 1 year, 3 years, 5 years, 10 years and since launch, and download the table in Excel format.
Both plans invest in the same portfolio with the same fund manager. In a Regular plan, you invest through an intermediary who is paid a commission, which the fund recovers by charging a higher annual fee called the expense ratio. A Direct plan pays no commission, so its expense ratio is lower and slightly more of your money stays invested.
A benchmark is a standard index, such as the Nifty 50 or the BSE 100, used to measure how a fund is doing. It helps measure relative performance, judge risk, understand the strategy and make a fair comparison. Since January 2018, SEBI has directed that fund performance be measured against the Total Return variant of an index, which counts both price gains and dividends.
Following SEBI’s circular of 26 February 2026, the article groups them by company size (Large Cap, Large & Mid Cap, Mid Cap, Small Cap), across all sizes (Multi Cap, Flexi Cap), by investment style (Value, Contra, Dividend Yield, Focused), and by sector, theme or tax saving (Sectoral, Thematic, ELSS). For example, a Large Cap Fund must hold at least 80% of its assets in large-cap companies, which are the top 100 by market capitalization.
Sources
Main sources
AMFI, “Fund Performance”: https://www.amfiindia.com/otherdata/fund-performance
SEBI, “Categorization and Rationalization of Mutual Fund Schemes,” circular dated 26 February 2026: https://www.sebi.gov.in/legal/circulars/feb-2026/categorization-and-rationalization-of-mutual-fund-schemes_99983.html (we read the scheme table in a copy of the circular published at https://www.caalley.com/sebi26/1772079826878.pdf)
Other sources
Kotak Neo, “What is AMFI?”: https://www.kotakneo.com/investing-guide/articles/what-is-amfi/
Kotak Mutual Fund, “Direct vs Regular Plan”: https://www.kotakmf.com/Information/blogs/direct-vs-regular-plan
Business Standard (PTI), “Adopt total return index to benchmark schemes: Sebi to MFs,” 4 January 2018: https://www.business-standard.com/amp/article/pti-stories/adopt-total-return-index-to-benchmark-schemes-sebi-to-mfs-118010400873_1.html
Disclaimer: I have used Claude, an AI assistant, to rephrase the content in a presentable way.