

Where this post comes from: the concepts here come from the NISM (National Institute of Securities Markets) workbook for the Research Analyst certification exam, which is available through the NISM study materials portal (free registration needed). The bond yield and equity risk premium figures are linked inline to their sources. We did not read Benjamin Graham’s books directly; the Graham history comes from a secondary summary.
This article is about one simple relationship: earnings yield and the P/E ratio are two ways of looking at the same number. It is just 1 ÷ P/E. To make this easy to see, we use a familiar yardstick as an example: the US 10-year Treasury bond yield, which foreign institutional investors (FIIs) and others watch closely. The bond is only an example. The real subject is how P/E and earnings yield relate to each other, and how that connects to the idea of a margin of safety. It is only an interesting comparison, not a buy or sell call.
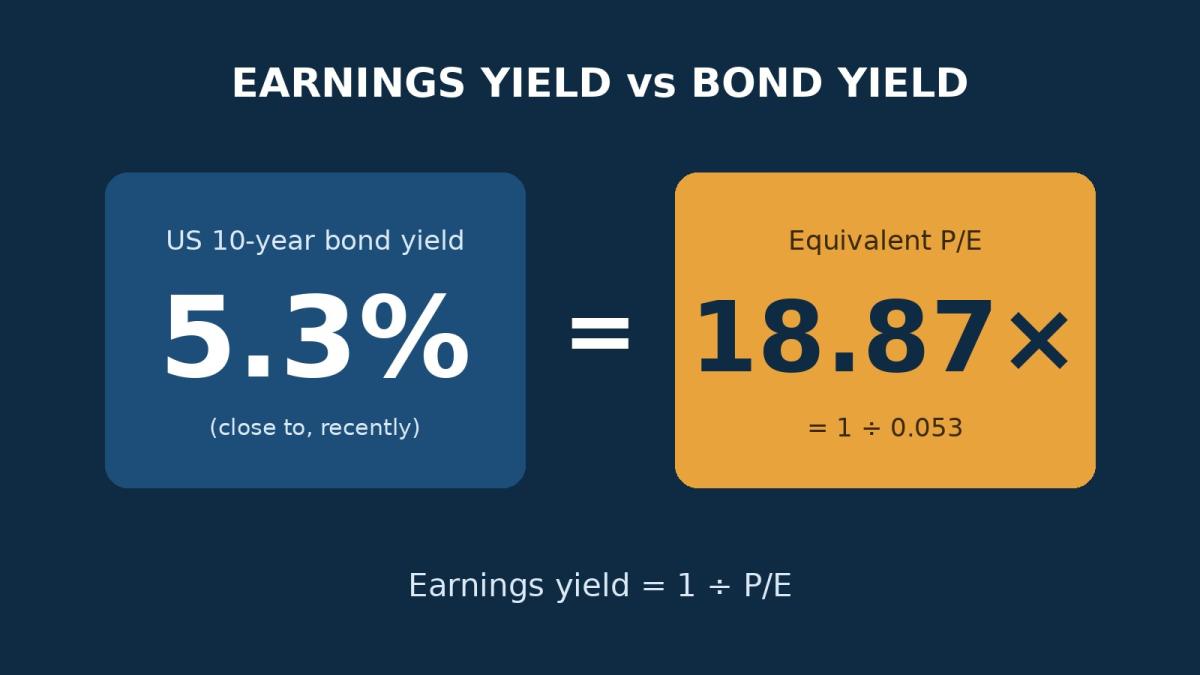
The short answer: P/E and earnings yield are reciprocals, so any yield can be turned into a P/E and any P/E into a yield. As an example, a US 10-year bond yield close to 5.3% matches a P/E of about 18.87×. The rest of this article shows where that number comes from, starting with the idea behind it.
What is margin of safety?
Margin of safety is a term made popular by Benjamin Graham, often called the father of value investing. Graham and Dodd introduced the idea in their 1934 book Security Analysis. In simple words, it is the gap between what a business is worth (its intrinsic value) and the price you pay. The wider the gap, the bigger your cushion.
Two points are worth remembering. First, a margin of safety does not guarantee a good investment. It only gives you room for error if your estimate of value turns out to be wrong. Second, working out a company’s “true” worth is subjective, and there is no standard rule for how wide the margin should be. Every investor has to decide their own number.
Margin of safety in the purchase price
The first kind of margin of safety is about price: at what price am I buying this company? Even an excellent business can become a risky investment if you pay too much for it. A lower purchase price, compared with the underlying business value, gives you a bigger valuation cushion.
But this raises a practical problem. If value is subjective, how do we judge price? One tool is to compare the stock with the safest alternative available: a government bond.
Earnings yield: the P/E ratio turned upside down
Earnings yield is earnings per share (EPS) divided by the current share price. The price-to-earnings (P/E) ratio is the opposite: share price divided by EPS. So the two are simply reciprocals of each other:
Earnings yield = 1 ÷ P/E
Analysts often turn to earnings yield when dividend yields are low, because it shows what the business earns for each rupee invested, whether or not it pays all of that out. Here is how the two line up:
| P/E | Earnings yield |
|---|---|
| 5× | 20% |
| 10× | 10% |
| 12.5× | 8% |
| 20× | 5% |
| 25× | 4% |
A low P/E means a high earnings yield, and a high P/E means a lower yield.
Using a bond yield to read earnings yield and P/E
Now let us put the relationship to work. Any yield can be flipped into an “equivalent P/E”. As an example, take the US 10-year Treasury bond. Its yield has been close to 5.3% recently, near its highest level in years. We chose it only because it is widely followed; any other rate would work the same way. This is not today’s exact figure, and bond yields change every day. Using the same reciprocal rule, an FII choosing the bond over shares is effectively getting this P/E:
P/E = 1 ÷ 0.053 = 18.87×
| Bond yield | Equivalent P/E |
|---|---|
| 10% | 10× |
| 8% | 12.5× |
| 7% | 14.29× |
| 6% | 16.67× |
| 5.3% | 18.87× |
| 5% | 20× |
| 4% | 25× |
Here is a quick example with three imaginary stocks. One trades at a P/E of 12.5×, so its earnings yield is 8%. A second trades at 18.87×, so its yield is 5.3%. A third trades at 25×, so its yield is 4%. Set against a bond yielding about 5.3%, the first earns more than the bond, the second matches it, and the third earns less.
What does 18.87× tell us? It is simply a comparison point, not a recommendation to buy or avoid anything. At that P/E, a stock’s earnings-to-price return equals the bond yield. Below it, the stock’s yield is higher than the bond’s, which is where the margin-of-safety idea comes in. Above it, the bond’s yield is higher.
Earnings yield in the real world
Analysts do make this comparison. The S&P 500’s earnings yield was about 3.8% in late September 2026, with the gap over the inflation-adjusted 10-year Treasury yield (2.86%) under 1 percentage point. Fortune’s write-up links this gap to the margin-of-safety idea.
For more on why rising US yields matter to Indian markets, see our article Why US Bond Yields Are Bad News for Indian Stocks.
Does a high P/E mean “overvalued”? Not by itself
It is tempting to read the 18.87× line as a rule: P/E above it is bad, P/E below it is good. That is too simple, and here is why.
A bond’s yield is fixed. A company’s earnings can grow. A business whose earnings grow quickly can look expensive today and still earn a healthy return later. So a higher P/E does not automatically mean overvalued. In the same way, a low P/E can be a trap if earnings are about to fall, and a stock that looks expensive can stay expensive for a long time.
There is also a warning from the research side. Fisher Investments argues that the gap between earnings yield and bond yield is not a reliable predictor of market direction, since stocks and bonds have different drivers. And earnings are an accounting number, not cash in your hand.
This article is for information only and is not investment advice. Figures change daily, and any mistakes in summarising the sources are the author’s.
Key takeaways
- Two sides of one number: Earnings yield is 1 ÷ P/E, so a P/E of 20× is a 5% yield, and a P/E of 12.5× is 8%. Flip one and you get the other.
- Any yield can become a P/E: A bond yield close to 5.3% matches an equivalent P/E of about 18.87× (1 ÷ 0.053). The US bond is only an example of the idea.
- Margin of safety: It is the gap between value and price. A stock with a higher earnings yield than a safe bond leaves more room for error, but there is no universal rule for how wide the margin should be.
- What it cannot tell you: A higher P/E does not automatically mean overvalued, since earnings can grow while a bond’s yield is fixed. Use earnings yield as one yardstick, not a buy or sell signal.
Frequently asked questions
Earnings yield is a company’s earnings per share (EPS) divided by its share price. It shows how much the business earns for each rupee invested in the stock. It is the reciprocal of the P/E ratio.
Divide 1 by the P/E. A P/E of 10× gives an earnings yield of 10%, a P/E of 20× gives 5%, and a P/E of 25× gives 4%.
Use the same rule in reverse: P/E = 1 ÷ yield. For example, a US 10-year Treasury yield close to 5.3% recently gives 1 ÷ 0.053 = about 18.87×. This is only an example, and bond yields change every day.
Not by itself. A bond’s yield is fixed, but a company’s earnings can grow, so a higher P/E can still make sense for a fast-growing business. The comparison is a yardstick, not a verdict.
Margin of safety is the gap between what a business is worth (its intrinsic value) and the price you pay. A wider gap gives more cushion if your estimate of value is wrong, but it does not guarantee a good investment.
Sources
Main sources
NISM (National Institute of Securities Markets), Research Analyst certification workbook: the sections on margin of safety and earnings yield (via the NISM study materials portal).
Trading Economics: United States 10-year government bond yield
Other sources
Fortune: equity risk premium (29 September 2026)
Fisher Investments: A Gap That Isn’t Worth Minding Much
Wikipedia: Margin of safety (financial)
I used Claude, an AI assistant, to rephrase my notes to make it reader friendly.