

Every month, on or around the 20th, India’s Ministry of Commerce and Industry quietly releases a number that most people scroll past. It’s called the Index of Core Industries, or ICI. Read correctly, it tells you something about the health of the whole economy — weeks before the bigger, more famous industrial output numbers arrive.
The latest release, dated 21 September 2026, showed the ICI grew 4.8% year-on-year in August 2026. That’s a shade lower than the 5.0% growth recorded in July. On its own, that sounds like a rounding footnote. Underneath it, though, is a much sharper story: a widening gap between industries riding India’s construction and capital-spending boom, and energy-linked industries that are actually shrinking.
Here’s what the ICI is, what August’s numbers really say, and — because it trips a lot of people up — whether India even produces its own crude oil.
What is the Index of Core Industries?
The ICI is a monthly indicator that tracks the combined production of eight — now nine — of India’s most foundational industrial sectors: Electricity, Refinery Products, Steel, Crude Oil, Coal, Iron Ore, Cement, Natural Gas, and Fertilizers.
Think of these as the industries everything else is built on top of. A factory needs electricity and steel. A building needs cement. A vehicle needs refined fuel and steel. When these nine sectors are humming, it’s usually a sign that broader industrial activity — and infrastructure spending — is humming too.
A quick note on wording: when this data talks about “production performance,” it means the relative change in the physical volume of goods produced — tonnes of steel, units of electricity, barrels of crude — not the absolute raw quantity. It’s a measure of momentum, not size.
The August 2026 numbers, visually
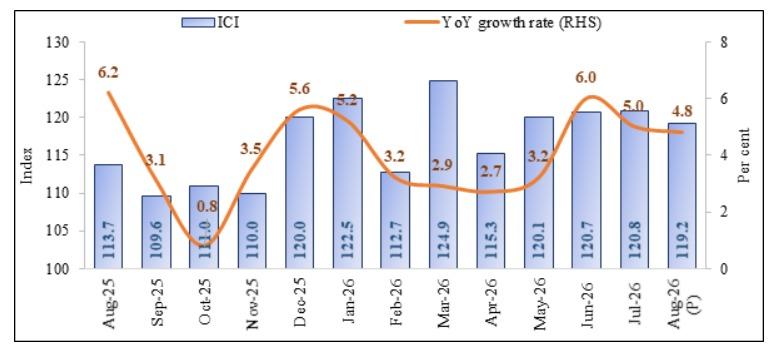
The chart tells the recent story in one glance: growth peaked around 6.0% in June 2026, and has eased for two straight months since — 5.0% in July, now 4.8% in August (provisional).
Two things worth flagging about “provisional.” First, it means this is an early estimate, released quickly so analysts and policymakers don’t have to wait for every last data point. Second, provisional numbers get revised — often within a percentage point. Case in point: July’s index was first estimated at 121.2 (a provisional 5.4% growth), and has now been finalised at 120.8, which works out to 5.0% growth. August’s 119.2 (4.8%) is today’s provisional read, and it too could shift slightly next month.
A tale of two economies, inside one index
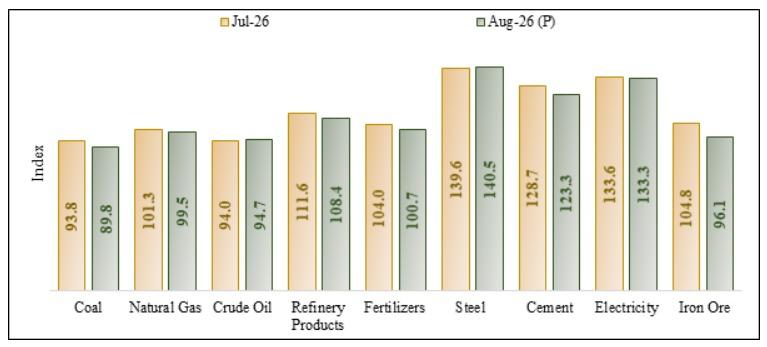
The headline 4.8% hides a real divergence. Five sectors grew; four shrank.
The capex-and-infrastructure side of the story, all growing strongly year-on-year: Cement (+12.5%), Electricity (+11.6%), Iron Ore (+5.5%), Steel (+3.4%), and Refinery Products (+2.6%).
The energy-drag side of the story, all contracting year-on-year: Fertilizers (−12.4%, the steepest fall of the nine), Natural Gas (−4.9%), Coal (−3.8%, a sharp reversal from +7.6% growth in July), and Crude Oil (−3.6%).
Put simply: sectors that track construction activity and corporate capital expenditure are still expanding at a healthy clip. Sectors tied to extraction and upstream energy are pulling the index down. That’s a “steady but mildly softening” picture, not a worrying one.
Wait — does India even produce crude oil?
This is worth pausing on, because “Crude Oil” sitting inside an Indian economic index confuses a lot of readers. Isn’t crude oil something India only imports?
Not quite. India does extract crude oil domestically — through state-run companies like ONGC and Oil India, from fields in the Western Offshore (Mumbai High), Assam, Gujarat, and Rajasthan. The trouble is scale: India is the world’s third-largest oil consumer, and domestic production covers only a small fraction of that demand, with the rest met through imports.
Domestic output has also been gradually declining over the years, largely because many of India’s oil fields are old and running out of easy-to-extract reserves. For a deeper look at India’s oil and gas landscape — production, imports, and the companies involved — see this overview on Wikipedia.
So when the ICI reports “negative growth” for Crude Oil, it isn’t talking about imports or prices at all — it’s measuring how much oil India physically pulled out of its own ground that month versus a year earlier, and lately that number has been sliding.
Why does this number matter at all?
Two reasons. It’s an early warning system — these nine sectors make up a large share of the broader Index of Industrial Production (IIP), the bigger measure of India’s factory, mining, and electricity output compiled by the National Statistical Office. Because ICI comes out before the IIP each month, it gives a reasonably reliable early read on where the bigger number will land.
It’s also a direct pulse-check on infrastructure and capex — steel, cement, and iron ore output move in near lockstep with construction and corporate capital spending, so their current growth is a tangible sign the capex cycle is still running.
Index value vs. growth rate — two different numbers
The index value compares current output to a fixed base period — currently the 2022-23 financial year, set at 100. Cement’s index at 123.3 means production that month was 23.3% higher than the average monthly output during 2022-23.
The growth rate compares output to the same month a year ago — ICI at 4.8% means combined output was 4.8% higher than in August 2025.
The bottom line
August’s data points to two things at once: continued structural expansion (the core economy is meaningfully larger than a year ago, and the capex cycle looks intact), and a marginal deceleration (growth has cooled from June’s 6.0% peak to 5.0% in July to 4.8% in August). The more interesting story is beneath the headline: infrastructure-linked sectors are carrying this index, while upstream energy sectors are dragging it down — worth watching in the months ahead.
This article is for general information only and should not be treated as investment advice. Figures are based on the Ministry of Commerce and Industry’s provisional data as of the date of publication and are subject to revision; any errors in summarising the data are the author’s own.
Key takeaways
- The headline: The Index of Core Industries (ICI) grew 4.8% year-on-year in August 2026 (provisional), down from 5.0% in July and a peak of around 6.0% in June, according to the Ministry of Commerce and Industry’s release of 21 September 2026.
- The split: Five sectors grew: Cement (+12.5%), Electricity (+11.6%), Iron Ore (+5.5%), Steel (+3.4%) and Refinery Products (+2.6%). Four shrank: Fertilizers (−12.4%), Natural Gas (−4.9%), Coal (−3.8%) and Crude Oil (−3.6%).
- How to read it: The figures are provisional and get revised, often within a percentage point. July was first estimated at 5.4% growth and finalised at 5.0%. The growth rate compares output with the same month a year earlier, while the index value compares it with the 2022-23 base of 100.
Frequently asked questions
The ICI is a monthly indicator, released by India’s Ministry of Commerce and Industry on or around the 20th of each month. It tracks the combined production of nine foundational sectors: Electricity, Refinery Products, Steel, Crude Oil, Coal, Iron Ore, Cement, Natural Gas and Fertilizers. It measures the relative change in the physical volume produced, so it is a measure of momentum, not size.
Combined output grew 4.8% year-on-year (provisional), a shade lower than the 5.0% in July and below a peak of around 6.0% in June. Five sectors grew and four shrank. Cement (+12.5%) and Electricity (+11.6%) grew the most, while Fertilizers (−12.4%) fell the most.
These nine sectors make up a large share of the Index of Industrial Production (IIP), and the ICI comes out before the IIP each month, so it gives a reasonably reliable early read on where the bigger number will land. Steel, cement and iron ore output also move in near lockstep with construction and corporate capital spending, so the ICI works as a pulse-check on infrastructure and capex.
Yes, but only a small fraction of what it consumes. State-run companies like ONGC and Oil India extract crude from fields in the Western Offshore (Mumbai High), Assam, Gujarat and Rajasthan. India is the world’s third-largest oil consumer, and the rest of its demand is met through imports. When the ICI reports negative growth for crude oil, it measures domestic output, not imports or prices.
The index value compares current output with a fixed base period, the 2022-23 financial year set at 100. A cement index of 123.3 means production that month was 23.3% higher than the average monthly output in 2022-23. The growth rate compares output with the same month a year ago, so 4.8% means combined output was 4.8% higher than in August 2025.
Sources
Main sources
Press Information Bureau — Provisional Index of Core Industries, August 2026 (Ministry of Commerce & Industry, 21 September 2026)
Other sources
Business Standard — “Core industries growth eases to 4.8% in August on iron ore, coal drag”
Whalesbook — “India Core Sector Growth Slows to 4.8% as Energy Weakens”
Drishti IAS — “Index of Core Industries with Base Year 2022-23”
Wikipedia — Oil and gas industry in India
The author used Claude, an AI assistant, to rephrase these notes into a more presentable, reader-friendly format.