

Where this post comes from: This is a plain-English explainer on how the circuit limit works on Indian stock exchanges. A circuit limit is a daily price band: the upper circuit caps a rise and the lower circuit caps a fall. It uses the sharp fall in two stocks on 24 September 2026 only as an example to show how the rules lead to different behaviour. The rules come from a SEBI master circular and NSE circulars. The price-move details come from news and market write-ups. We did not study exchange data ourselves.
On 24 September 2026, IRDAI, the insurance regulator, released a consultation paper on how much commission insurance sellers can earn. Two listed companies from the Financial Services sector, both in the Insurance Brokers industry, saw heavy selling that day: PB Fintech (which runs Policybazaar) and Turtlemint Fintech Solutions.
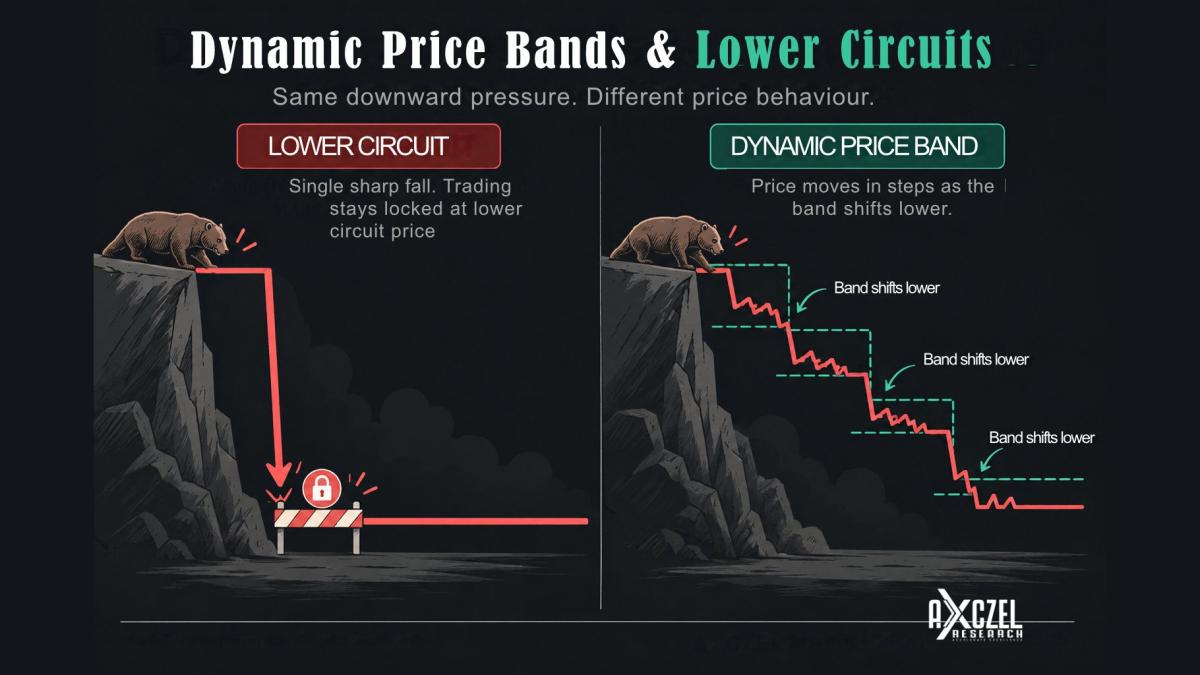
Both stocks crashed. But they crashed in very different ways. Turtlemint fell 20% at the very first trade and stayed frozen there all day. PB Fintech fell in steps through the day and ended roughly a third lower.
This raises two fair questions. If a lower circuit exists to stop a crash, why did PB Fintech fall by much more than 20%? And why did it fall in steps, instead of in one go?
The answer is that the two stocks are covered by two different rulebooks. We use them here only as examples to explain the difference.
What is a circuit limit?
A circuit limit is a cap on how far a stock’s price can move in one day, up or down, compared with the previous day’s closing price. If the price touches the lower limit, it is called a “lower circuit”. The idea is to give the market time to absorb news, instead of letting prices fall in a panic.
There are two kinds of limits, and it helps to keep them apart.
The first is the market-wide circuit breaker. It is based on the main index, not on any single stock. Under SEBI’s rules, if the index falls 10%, trading stops for a period. A 15% fall stops it for longer, and a 20% fall shuts the market for the rest of the day. This did not come into play here.
The second is the stock-wise price band. SEBI’s master circular says individual stocks can have price bands of up to 20% either way, for all stocks in normal (rolling) settlement, except stocks on which futures and options are available. NSE picks the band for each stock, from a set of levels such as 2%, 5%, 10% and 20%, based on how volatile the stock is.
Notice the exception. Stocks with futures and options (“F&O”) contracts are treated differently. That is the whole story of this article.
Example 1: a fixed 20% wall
Turtlemint is a recently listed company. It is not in the F&O segment, so it trades in the normal cash market with a fixed 20% band.
When the news came, sellers rushed in on the very first trade. The price dropped by 20%, which is the most the band allows. The exchange does not accept orders beyond that limit, so the stock was “locked” there for the rest of the day. There were many sell orders waiting, and very few buyers.
Example 2: a band that moves
PB Fintech is in the F&O segment. Stocks like this do not get a fixed daily limit. Instead, SEBI’s rules give them a “dynamic price band”, also called an operating range. It starts at 10% of the previous day’s closing price. The exchange may then widen it in steps, as the price keeps pushing against the edge.
The steps get smaller as the day goes on, and the waiting time between them gets longer. This is how the SEBI master circular describes it. For the first two widenings, the band is widened by 5% of the previous close, after a 15-minute wait. The wait is 5 minutes if this happens in the last half hour of trading. For the next two widenings, the band is widened by 3%, after a 30-minute wait. After that, the band is widened by 2% each time, after a 60-minute wait.
Now compare this with what happened. PB Fintech opened at the 10% lower band. Then the lower band was moved to 15%, 20%, 23%, 26%, 28%, 30%, 32% and 34%. Each time the lower band moved, the price dropped straight down to the new limit and sat there. On a chart, this looks like a staircase.
This also explains something that looks odd at first. The first two steps were both 5 percentage points wide (10% to 15%, and 15% to 20%). After that, the steps were 3 points, and then 2 points. The waiting time grew from 15 minutes to 30 and then to 60 minutes. That is why the fall was quick in the morning and slower later in the day.
So why did the lower circuit “not help”?
Because a circuit limit is a speed bump, not a floor.
It does not remove the sellers. It only stops trades from happening beyond a price. When a stock like Turtlemint freezes at its lower limit, the selling does not go away. It simply waits in a queue. A frozen price is not a sign that the stock is “safe”. It can also mean nobody wants to buy at any price the rules allow.
For a stock in F&O, the speed bump is made to move on purpose. The thinking, as stated in the SEBI circular, is to give traders enough time to understand company or market news, while keeping price moves orderly and reducing strain on settlement. For a stock that large investors also trade through futures and options, freezing the price at a fixed level would create other problems. Traders who hold F&O positions need a price that keeps moving so they can adjust their positions. So the design lets the price find its own level, but slowly and in steps.
On 24 September, this meant the sellers had someone to sell to at each new lower level, and the price kept falling until buyers finally showed up in the afternoon.
A short note on surveillance
Circuit limits are only one tool. Exchanges also run “surveillance” measures such as ASM (Additional Surveillance Measure) and GSM (Graded Surveillance Measure). In simple terms, GSM looks at stocks whose value does not seem to match their business, while ASM looks at unusual jumps in price and trading volume. Once a stock is put under these measures, the exchange may raise margins or narrow its price band. According to the NISM workbook, ASM does not apply to stocks that have derivative contracts.
What to take away from the circuit limit rules
A “lower circuit” is not a promise that a stock will stop falling. It is a rule about how far the price may move in a day. Stocks in the cash market get a fixed limit, so they freeze. Stocks in F&O get a moving limit, so they slide.
Neither design can stop investors from re-pricing a company when the news is bad. What the rules do is decide how that re-pricing happens: in one sudden stop, or in a series of steps. Knowing which rulebook applies to a stock helps you understand what you are seeing on the screen.
This article is for information only and is not investment advice. The companies named are used only as examples to explain market rules. Rules and figures may change, and any mistakes in summarizing them are the author’s own.
Key takeaways
- What a circuit limit is: It is a cap on how far a stock’s price can move in one day compared with the previous day’s close. The article calls it a speed bump, not a floor: it stops trades beyond a price but does not remove the sellers.
- Two rulebooks: Stocks in the cash market get a fixed limit, such as 20%, so they freeze at it. Stocks with futures and options get a dynamic price band that starts at 10% and is widened in steps, so the price slides in steps.
- The example: On 24 September 2026, after IRDAI released a consultation paper on insurance commissions, Turtlemint fell 20% at the first trade and stayed frozen, while PB Fintech fell in steps and ended roughly a third lower. The article uses both only as examples of how the rules work.
Frequently asked questions
A circuit limit is a cap on how far a stock’s price can move in one day, up or down, compared with the previous day’s closing price. If the price touches the lower limit, it is called a lower circuit. The idea is to give the market time to absorb news, instead of letting prices fall in a panic.
The market-wide circuit breaker is based on the main index. Under SEBI’s rules, a 10% fall in the index stops trading for a period, a 15% fall stops it for longer, and a 20% fall shuts the market for the rest of the day. The stock-wise price band applies to individual stocks, with bands of up to 20% either way for stocks in normal settlement, except those on which futures and options are available.
Turtlemint is not in the F&O segment, so it has a fixed 20% band and was locked at the lower limit. PB Fintech is in the F&O segment, so it has a dynamic price band that starts at 10% and is widened in steps, which is why it fell in steps through the day. The article uses these two stocks only as examples.
It starts at 10% of the previous day’s closing price. For the first two widenings, the band is widened by 5% of the previous close after a 15-minute wait, or a 5-minute wait in the last half hour of trading. For the next two widenings it is widened by 3% after a 30-minute wait, and after that by 2% each time after a 60-minute wait.
No. A lower circuit is a rule about how far the price may move in a day, not a promise that it will stop falling. When a stock freezes at its lower limit, the selling does not go away. It simply waits in a queue.
Sources
Main sources
SEBI, Master Circular for Stock Exchanges and Clearing Corporations (30 December 2024), Chapter 1 – Trading, sections 2.1 to 2.5: SEBI master circular, Chapter 1 – Trading
NSE Circular NSE/FAOP/63405 (14 August 2024), dynamic price bands: NSE circular
Marketcalls, “IRDAI Distribution Reform: Why PB Fintech Crashed 36% and Insurance Stocks Fell on 24 September 2026”: Marketcalls article
Other sources
Inc42, “PB Fintech Crashes 36%, Turtlemint 20% On IRDAI Commission Cap Plan”: Inc42 article
MarketsMojo, Turtlemint hits lower circuit: MarketsMojo article
Groww, list of 45 stocks added to NSE F&O on 29 November 2024: Groww article
NISM Series XV Research Analyst workbook (February 2026), section 14.5 on GSM and ASM.
I used Claude, an AI assistant, to rephrase my notes in a reader-friendly manner.