

Where this post comes from: The India forex reserves numbers and charts here come from the weekly “Foreign Exchange Reserves” tables that the Reserve Bank of India (RBI) publishes on its Weekly Statistical Supplement page. We downloaded the Excel files for 41 weeks (December 19, 2025 to September 25, 2026) and used the US$ column. The charts, the share percentages and the weekly up/down counts are our own calculations from those files. The section on why countries hold reserves leans on an IMF article and the RBI half-yearly report page for one sentence on how RBI manages reserves. We did not read the RBI report itself in full; that sentence is taken from its page on rbi.org.in, so please check the full report before relying on it.
Every Friday, RBI releases a small table that tells you how much foreign money and gold the country holds. These are India forex reserves. The table is free, takes one minute to open, and most people never look at it.
This post shows you where to find it, how to read each line, what 41 weeks of data look like, and why a country keeps such a pile in the first place.
What are India forex reserves?
Foreign exchange reserves, or forex reserves, are assets in foreign currencies and gold that the central bank holds on the country’s behalf. RBI reports them every week in a table called “Foreign Exchange Reserves”. You will also see the phrases forex reserves of India or India’s forex reserves used for the same thing.
The latest table shows total India forex reserves of US$747.6 billion as on September 25, 2026. It is a snapshot, like a bank balance, not a flow of money.
Where to get the India forex reserves data
You do not need a login. Here are the steps.
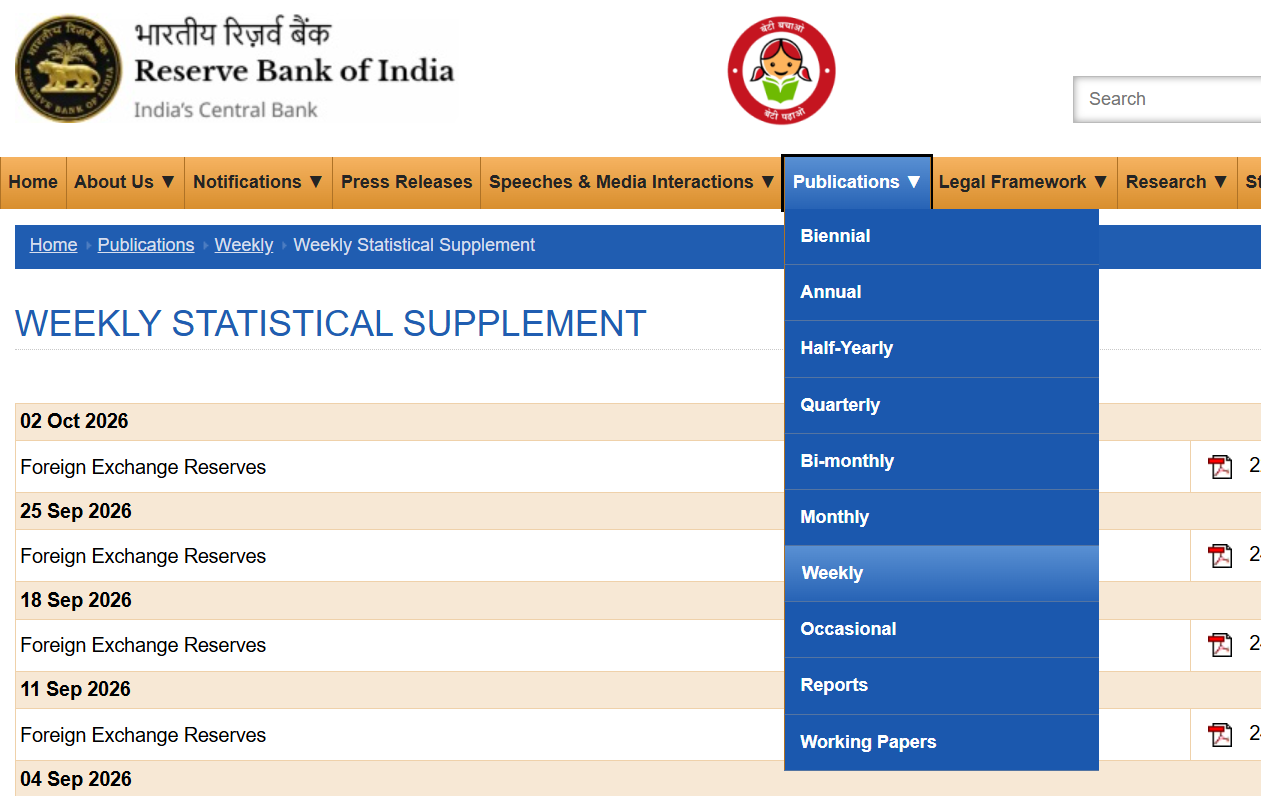
1. Go to the RBI website and open Publications, then Weekly, then Weekly Statistical Supplement. Or use this direct link.
2. You will see a list of dates. Under each date there is a row called “Foreign Exchange Reserves”.
3. Each row has two download icons. The Excel file is tiny, about 9 to 10 kb. The PDF is larger. Pick the Excel file if you want to build your own charts.
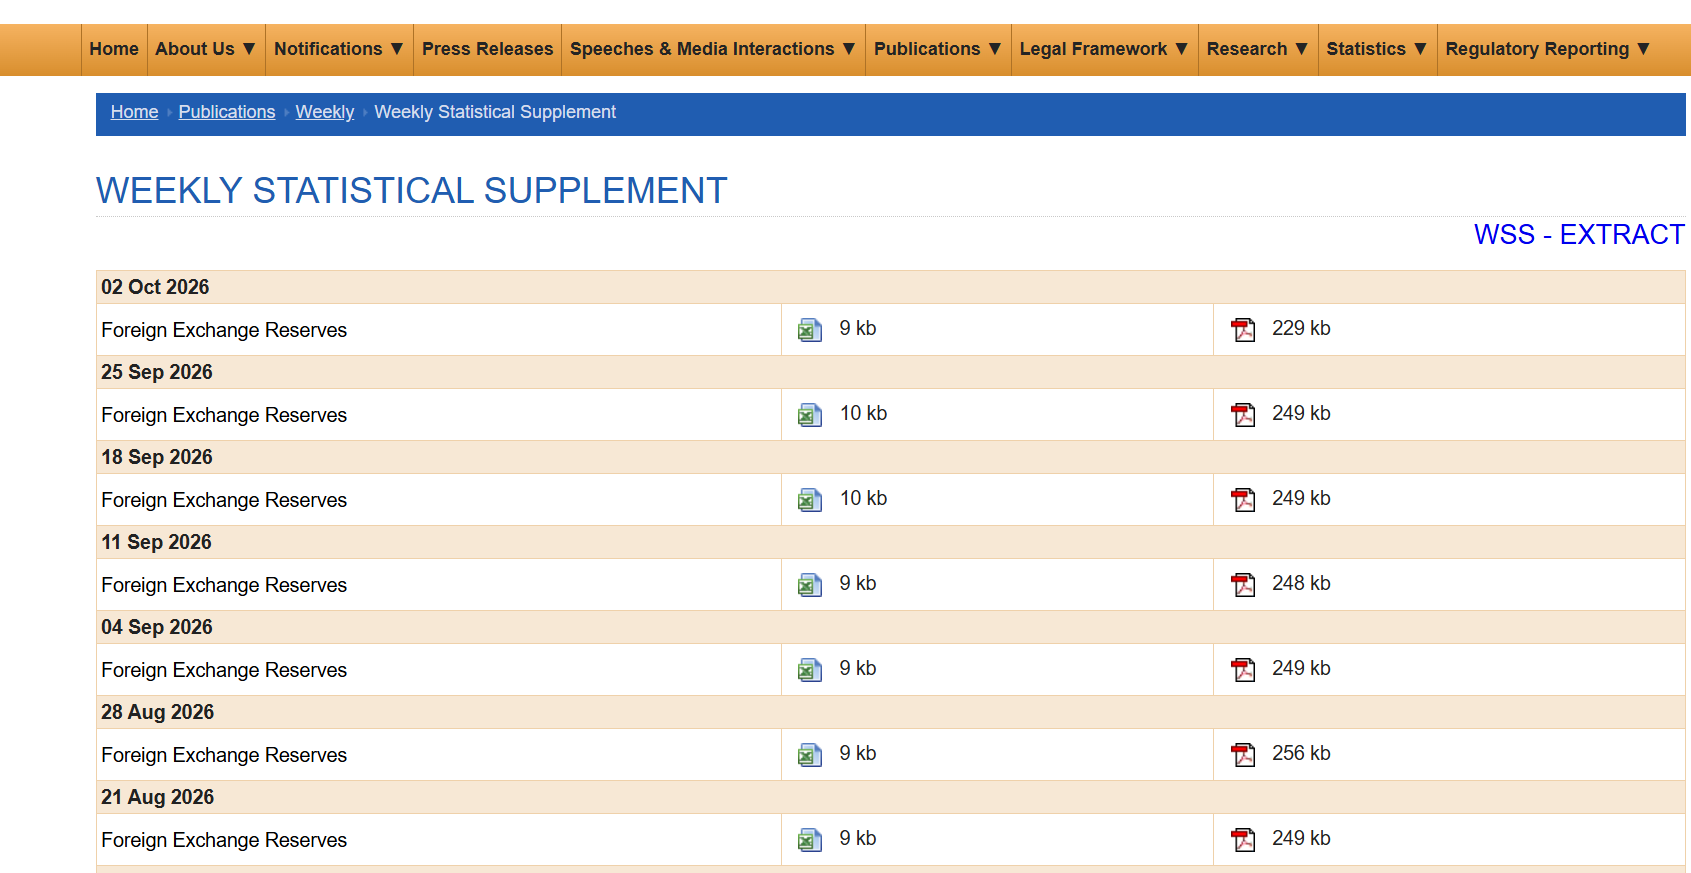
One date trap to know about. The date next to each row is the day RBI released the file, which is always a Friday. The date inside the table, written as “As on”, is the previous Friday. So the row dated October 2, 2026 holds data as on September 25, 2026. If you build your own sheet, use the “as on” date.
How to read the table: four components
The table splits total reserves into four lines. Here is the latest one, with our own share calculation.
| Line | What it is | US$ billion (as on Sep 25, 2026) | Share of total |
|---|---|---|---|
| Foreign Currency Assets | Money RBI holds in foreign currencies | 615.4 | 82.3% |
| Gold | RBI’s gold, shown as a dollar value | 108.7 | 14.5% |
| SDRs | Special Drawing Rights, an IMF reserve asset | 18.6 | 2.5% |
| Reserve Position in the IMF | India’s small position with the IMF | 4.8 | 0.6% |
Foreign Currency Assets (FCA) are the biggest part, at over 80% of the total.
Gold is shown as a dollar value, not a weight.
SDRs are a reserve asset created by the IMF. The IMF says an SDR is not a currency, but its value is based on a basket of five currencies.
The columns. After the level, the table shows the change over the week, since end-March, and over the year. Each comes in rupees (₹ crore) and in US dollars. We use the US$ columns because rupee figures also move when the exchange rate moves, which can hide what really changed.
A caution on reading changes. The weekly table shows how much a line changed. It does not say why. The dollar value of reserves can change when RBI buys or sells, and also when the value of what it already holds changes. The table does not separate the two. RBI’s half-yearly reports on reserve management go into more detail. This post describes what the numbers did. It does not guess the reasons.
India forex reserves trend: 41 weeks in charts
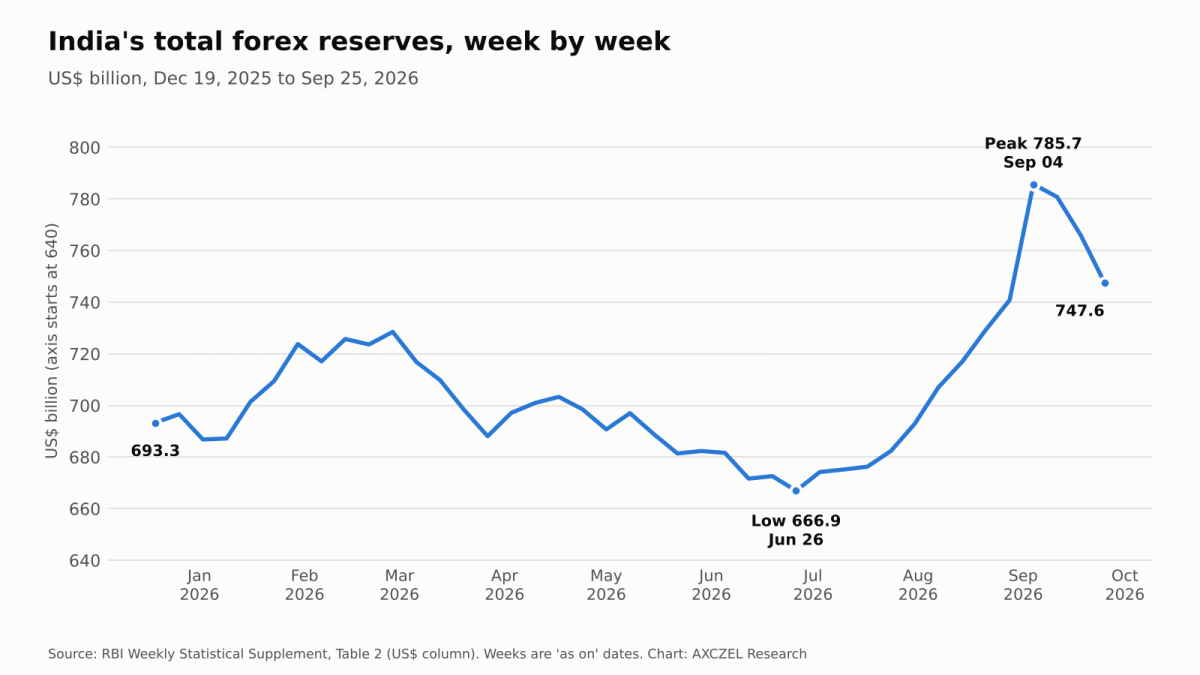
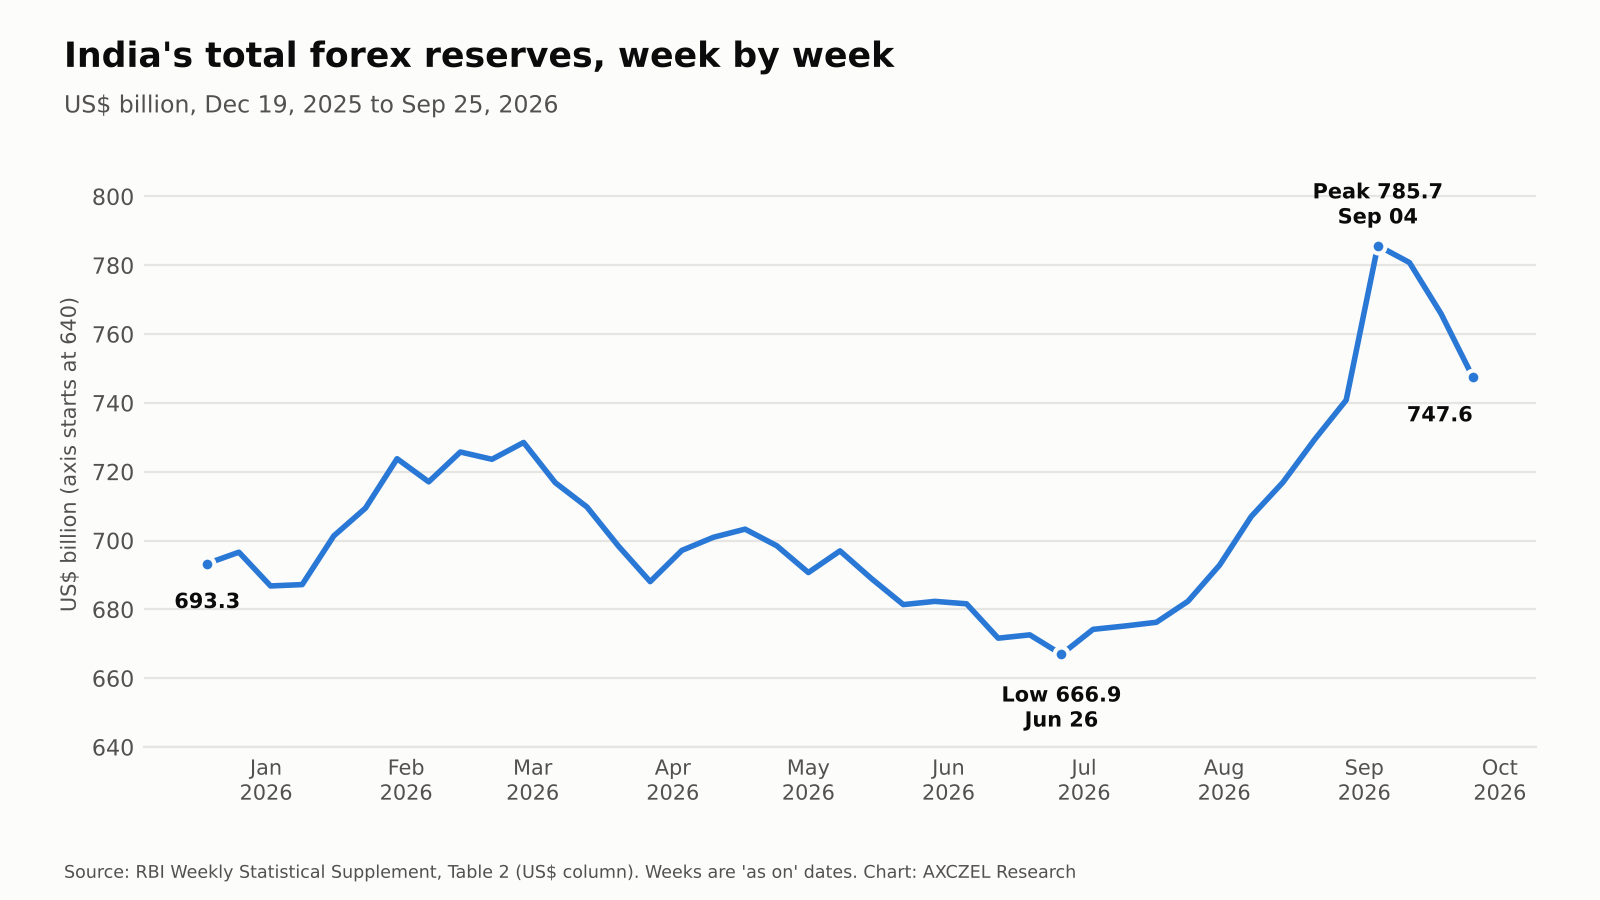
Total India forex reserves started the period at US$693.3 billion as on December 19, 2025. They dipped to a low of US$666.9 billion as on June 26, then climbed to a peak of US$785.7 billion as on September 4. The latest reading is US$747.6 billion, about US$54 billion above the starting point.
Week-on-week changes
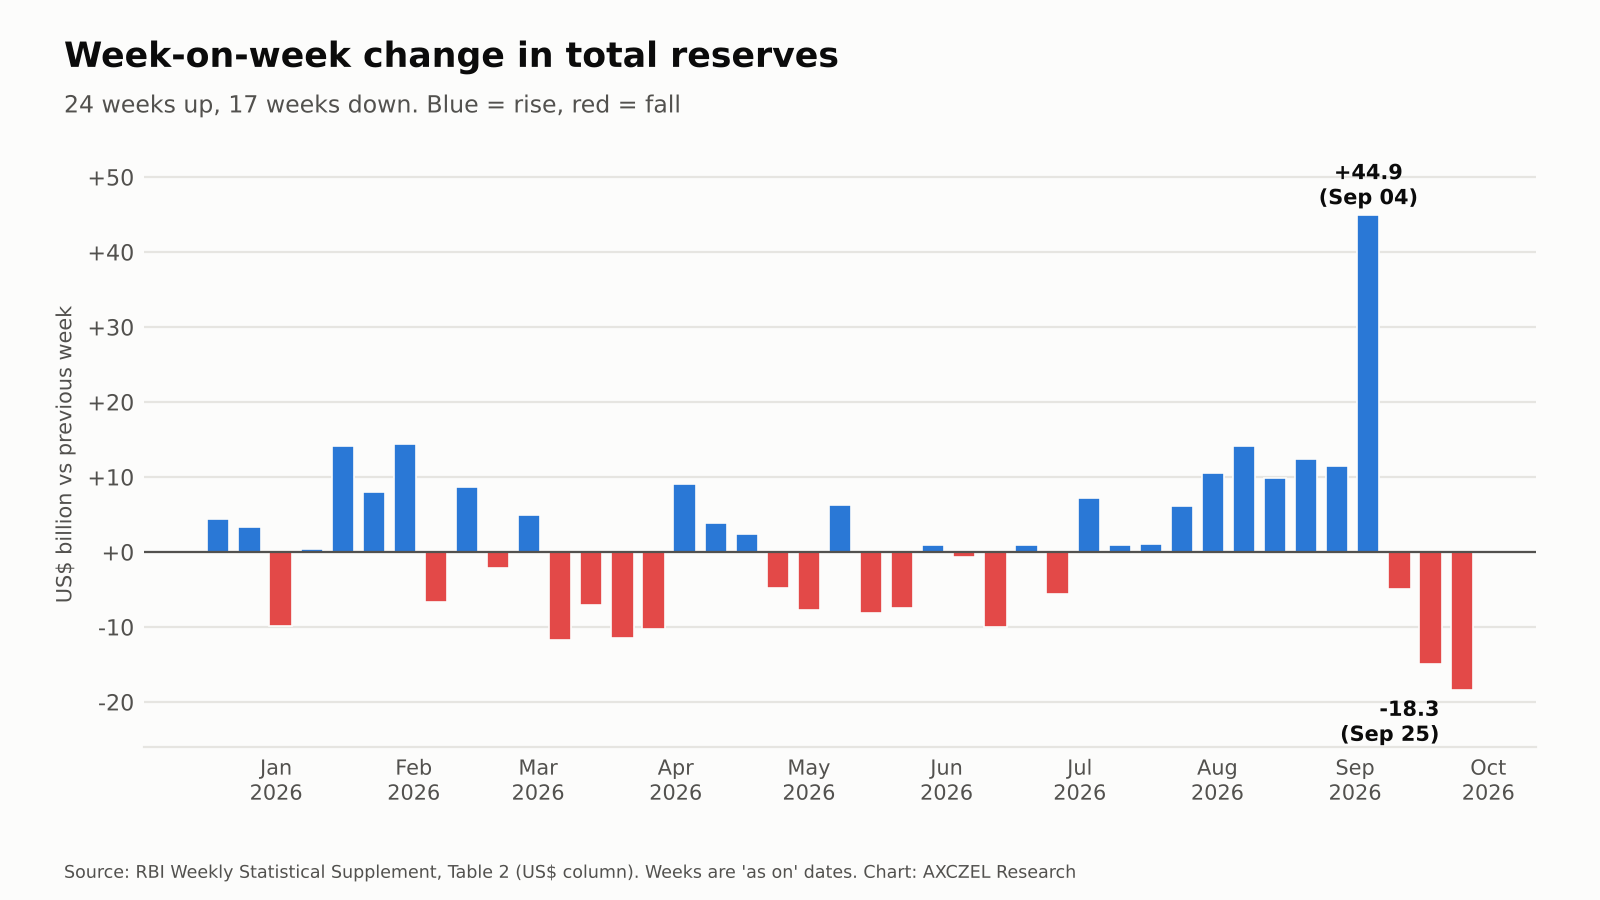
Reserves rose in 24 of the 41 weeks and fell in 17. In half of all weeks, the change was somewhere between a fall of about US$7 billion and a rise of about US$8 billion. Against that, the week as on September 4 stands out with a rise of US$44.9 billion, the largest in this period. The biggest fall was US$18.3 billion in the week as on September 25.
Foreign currency assets and gold trend
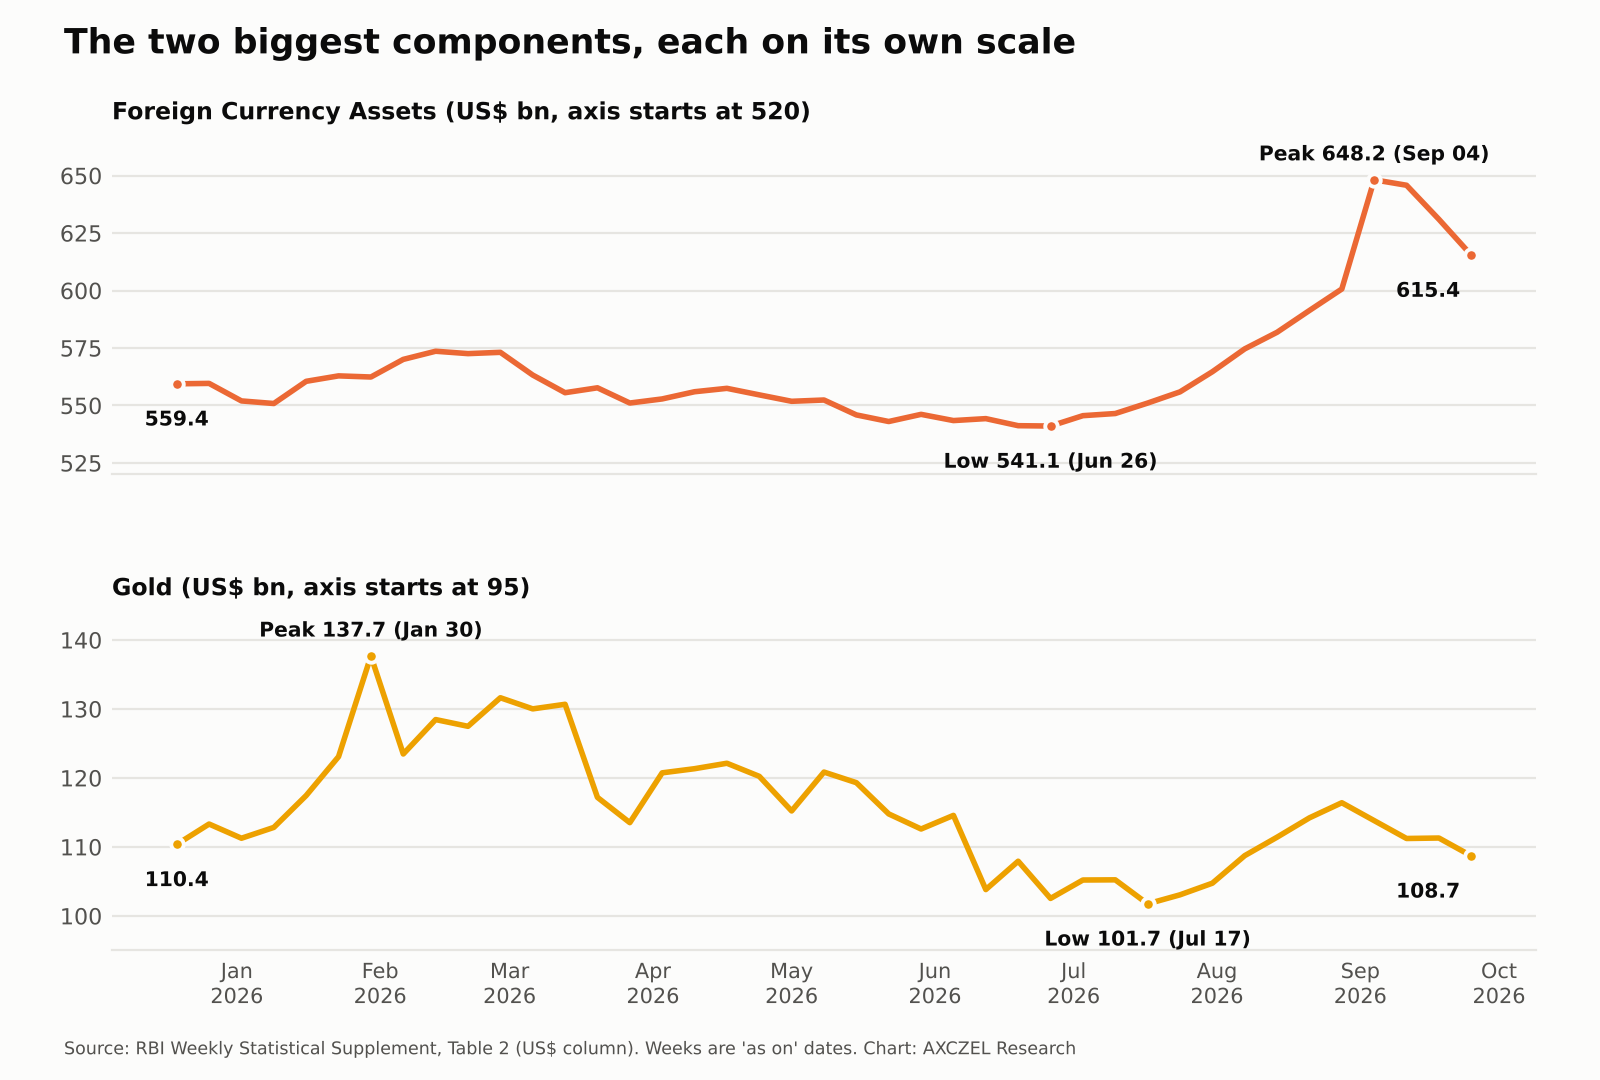
Foreign Currency Assets moved from US$559.4 billion to US$615.4 billion, a gain of about US$56 billion. Because FCA is over 80% of the total, its line looks almost the same as the total line. Its low was US$541.1 billion (June 26) and its peak was US$648.2 billion (September 4).
Gold tells a different story. It started at US$110.4 billion, jumped to a peak of US$137.7 billion in the week as on January 30, then slid to a low of US$101.7 billion (July 17). The latest value is US$108.7 billion, slightly below where it began.
The two charts below use separate scales on purpose. FCA is roughly five to six times larger than gold, so one shared axis would flatten gold’s movement.
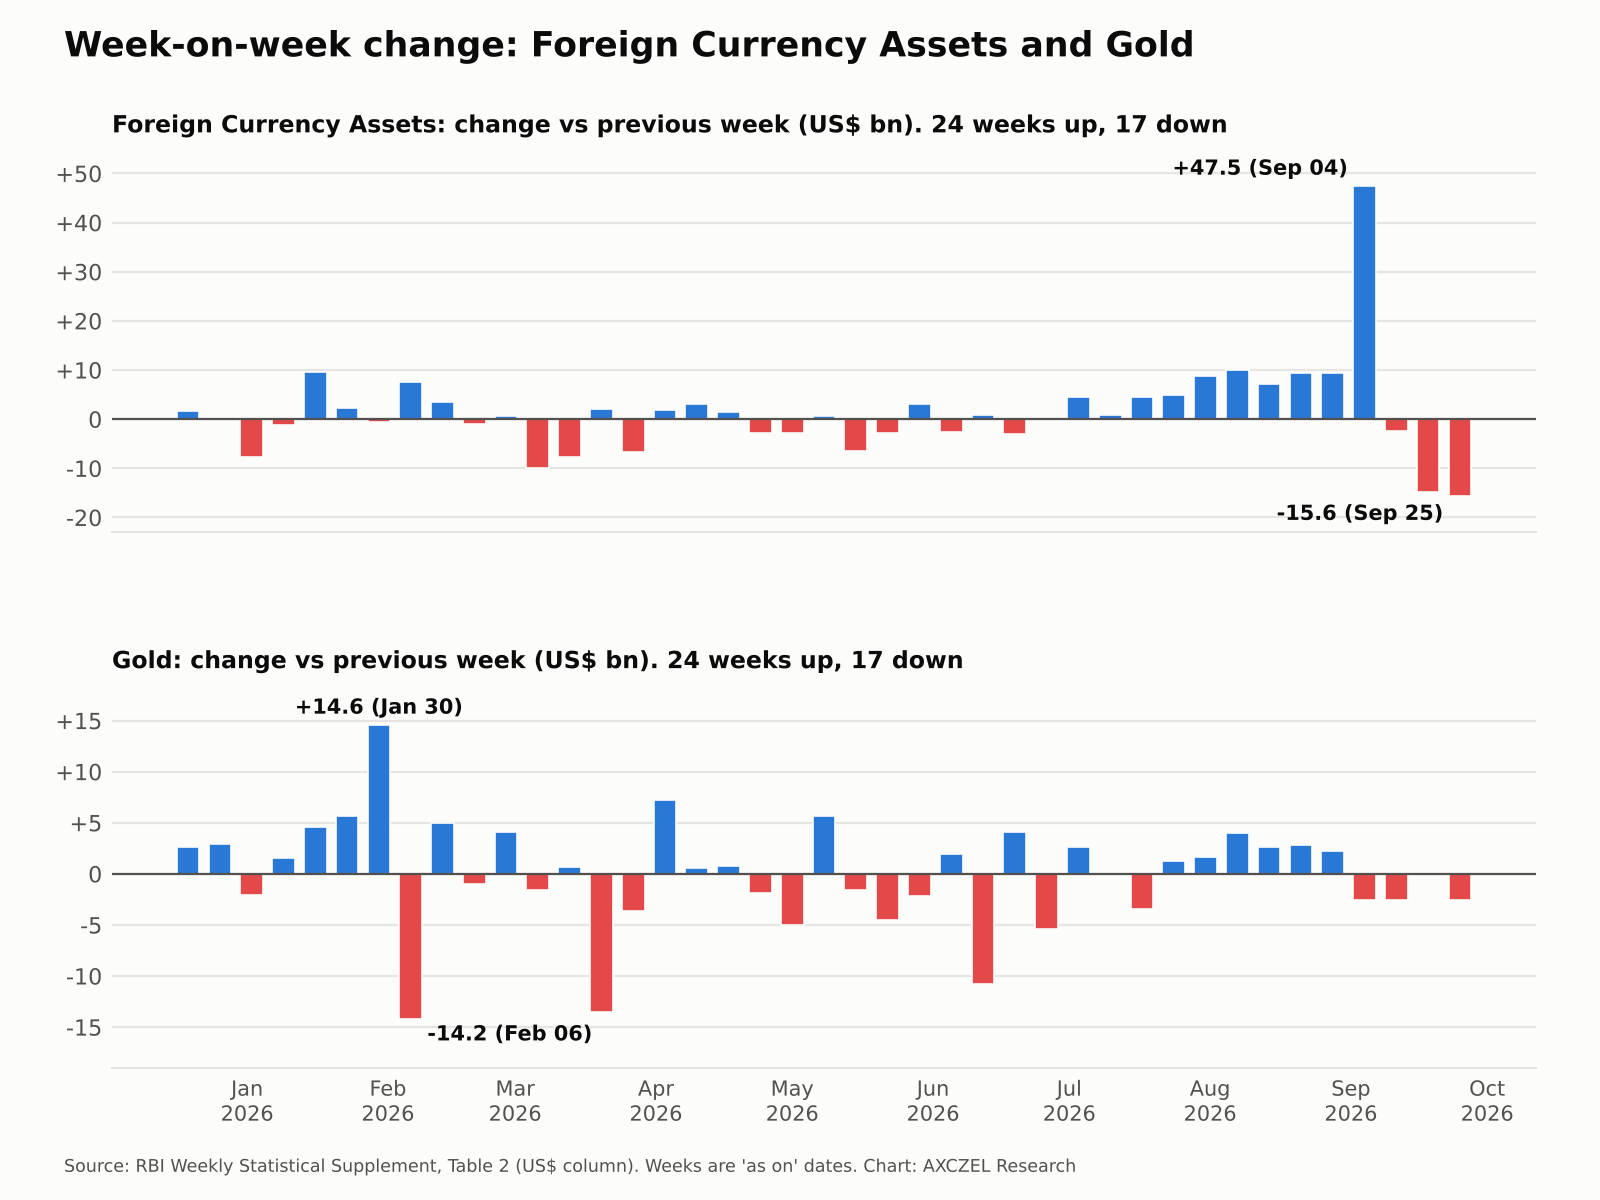
Week by week, the two parts behave differently. Foreign Currency Assets had their biggest rise of US$47.5 billion in the week as on September 4 and their biggest fall of US$15.6 billion in the week as on September 25. Gold’s biggest rise was US$14.6 billion (January 30) and its biggest fall was US$14.2 billion (February 6). Each of the two rose in 24 weeks and fell in 17, but not in the same weeks.
What India’s reserves are made of
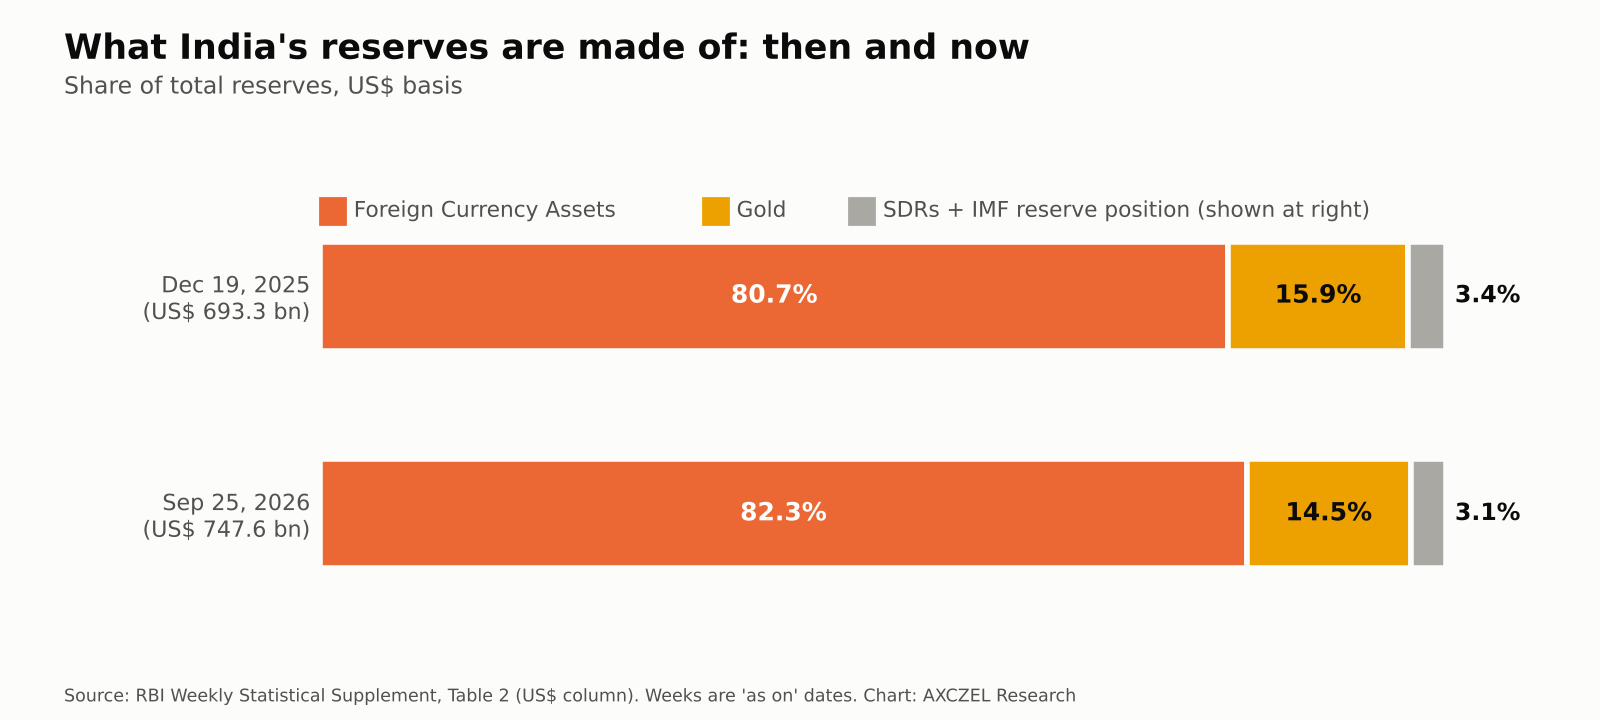
The mix of India forex reserves barely changed. FCA was 80.7% of the total at the start and 82.3% at the end. Gold went from 15.9% to 14.5%. SDRs and the IMF position together went from 3.4% to 3.1%.
Why does India hold forex reserves?
Reserves are a cushion. The IMF says reserves can provide space for authorities to respond to potential shocks and prevent chaotic market conditions. It lists other roles too, such as to build confidence in the national currency, support the conduct of monetary policy, and to influence the exchange rate.
RBI states how it manages them: safety and liquidity are the twin objectives of reserve management in India, with return optimisation kept in view within this framework. Put simply, the money must be safe and easy to turn into cash. Earning a return comes third. For another angle on RBI and the dollar, see our explainer on FCNR deposits.
A simple Friday routine
RBI releases this table every week, so you can build a habit of tracking India forex reserves.
1. Open the RBI weekly page and note the “As on” date, not the release date.
2. Read total reserves in the US$ column.
3. Look at the weekly change, then at Foreign Currency Assets and Gold separately.
4. Compare with the last four to eight weeks. One week alone says little.
Like working with free official data? We have similar how-to guides on bulk and block deals and the monthly FADA vehicle retail numbers.
This post is for information only and is not investment advice. Figures may change, and RBI can revise its data. Any mistakes in summarising the sources are the author’s.
Key takeaways
- What it is: India forex reserves are foreign assets and gold held by RBI, reported every Friday. The latest table shows US$747.6 billion as on September 25, 2026.
- Where to find the data: RBI website, Publications, Weekly, Weekly Statistical Supplement. Use the Excel icon, and read the “As on” date, which is a week before the release date.
- How to read it: Foreign Currency Assets are 82.3% of the total and gold is about 14.5%. The table shows how much a line changed, not why.
- What the trend shows: Over 41 weeks, India forex reserves ranged from US$666.9 billion to US$785.7 billion, with 24 weeks up and 17 down.
- Why they exist: The IMF describes reserves as space to respond to shocks, and RBI says safety and liquidity come first.
Frequently asked questions
They are the foreign currency assets, gold, SDRs and IMF position that RBI holds. The latest table shows US$747.6 billion as on September 25, 2026. RBI updates it every Friday, so check the RBI page for the newest week.
In the 41 weeks of data used here, the highest reading was US$785.7 billion as on September 4, 2026. This post does not cover earlier years, so it cannot say whether that is an all-time high.
On RBI’s Weekly Statistical Supplement page, under Publications and then Weekly. Each Friday release has a small Excel file and a PDF. The “As on” date inside the table is the previous Friday.
The latest RBI table shows gold at US$108.7 billion, about 14.5% of total reserves as on September 25, 2026. The table gives a dollar value, not tonnes.
Not necessarily. The dollar value of reserves can also change when the value of what RBI holds changes. The weekly table does not separate the two, so it cannot tell you the reason for a fall. RBI’s half-yearly report page covers reserve management in more detail.
The IMF says reserves help prevent chaotic market conditions and respond to shocks. RBI says safety and liquidity are the twin objectives.
Sources
Main sources
RBI, Weekly Statistical Supplement, Foreign Exchange Reserves. Weekly Excel files, as on December 19, 2025 to September 25, 2026. Shares and counts are our own arithmetic.
IMF, IMF Unveils New Way of Assessing Country Reserves.
Other sources
RBI, Half Yearly Report on Management of Foreign Exchange Reserves, October 2024 to March 2025. We did not read this report in full; only the one sentence quoted above is used.
IMF, Special Drawing Rights (SDR) factsheet.
RBI, list of Half Yearly Reports on Foreign Exchange Reserves.
I used Claude, an AI assistant, to rephrase my notes to make it reader friendly.