


Where this FADA vehicle retail data breakdown comes from: the numbers below are compiled from six monthly press releases published by FADA (Federation of Automobile Dealers Associations) between March and August 2026. Every figure is linked to the exact release it came from, so you can check it yourself.
If you’re an automobile lover — the kind who’s curious exactly how many two-wheelers, three-wheelers or cars got sold last month — this is a data source worth knowing about. You don’t need a paid data terminal to find out. FADA vehicle retail data is published free, every month, and anyone can download it.
FADA is the apex body of India’s automobile retail trade — founded in 1964, representing over 15,000 dealerships across more than 30,000 outlets, and an industry that employs close to 5 million people at dealerships and service centres. Each month it releases a simple table: how many two-wheelers (2W), three-wheelers (3W), passenger vehicles (PV), commercial vehicles, tractors and construction equipment were retailed across the country, compared with the previous month and with the same month a year earlier.
This piece is a short, layman’s guide to that FADA vehicle retail data: what it actually measures, where to find it, and what the last six months (March to August 2026) show for 2W, 3W and PV sales.
Why FADA vehicle retail data is different from “sales” numbers you see in the news
A lot of auto sales news is actually wholesale data — vehicles dispatched from factories to dealer showrooms, not vehicles a customer has driven home. FADA has long argued this overstates real demand, because a manufacturer can keep shipping vehicles to dealers even when showroom footfall is weak. Back in 2019, FADA highlighted a case where wholesale PV numbers showed a 31.57% decline while retail (actual registration) numbers showed a much smaller 7.13% drop for the same month — a reminder that the two data sets can tell very different stories.
FADA’s retail data instead comes from the government’s own Vahan vehicle-registration database, so it reflects what buyers actually took home. That’s the number worth tracking if you’re trying to gauge real consumer demand rather than factory output.
Where to find FADA vehicle retail data every month
FADA publishes this data as a short press release on fada.in, usually within the first few days of the following month. Each release is a downloadable PDF with a single summary table covering every vehicle category, plus MoM (month-on-month) and YoY (year-on-year) percentage changes already calculated for you. No login, no subscription, no paywall.
It’s part of a wider pattern worth knowing about: several government and industry bodies in India publish genuinely useful monthly data for free, if you know where to look. We’ve walked through one such example before, in India’s core industries data.
Six months of FADA vehicle retail data: 2W, 3W and PV, March–August 2026
Here’s what the monthly retail volumes for the three categories most people ask about looked like over the last six months:
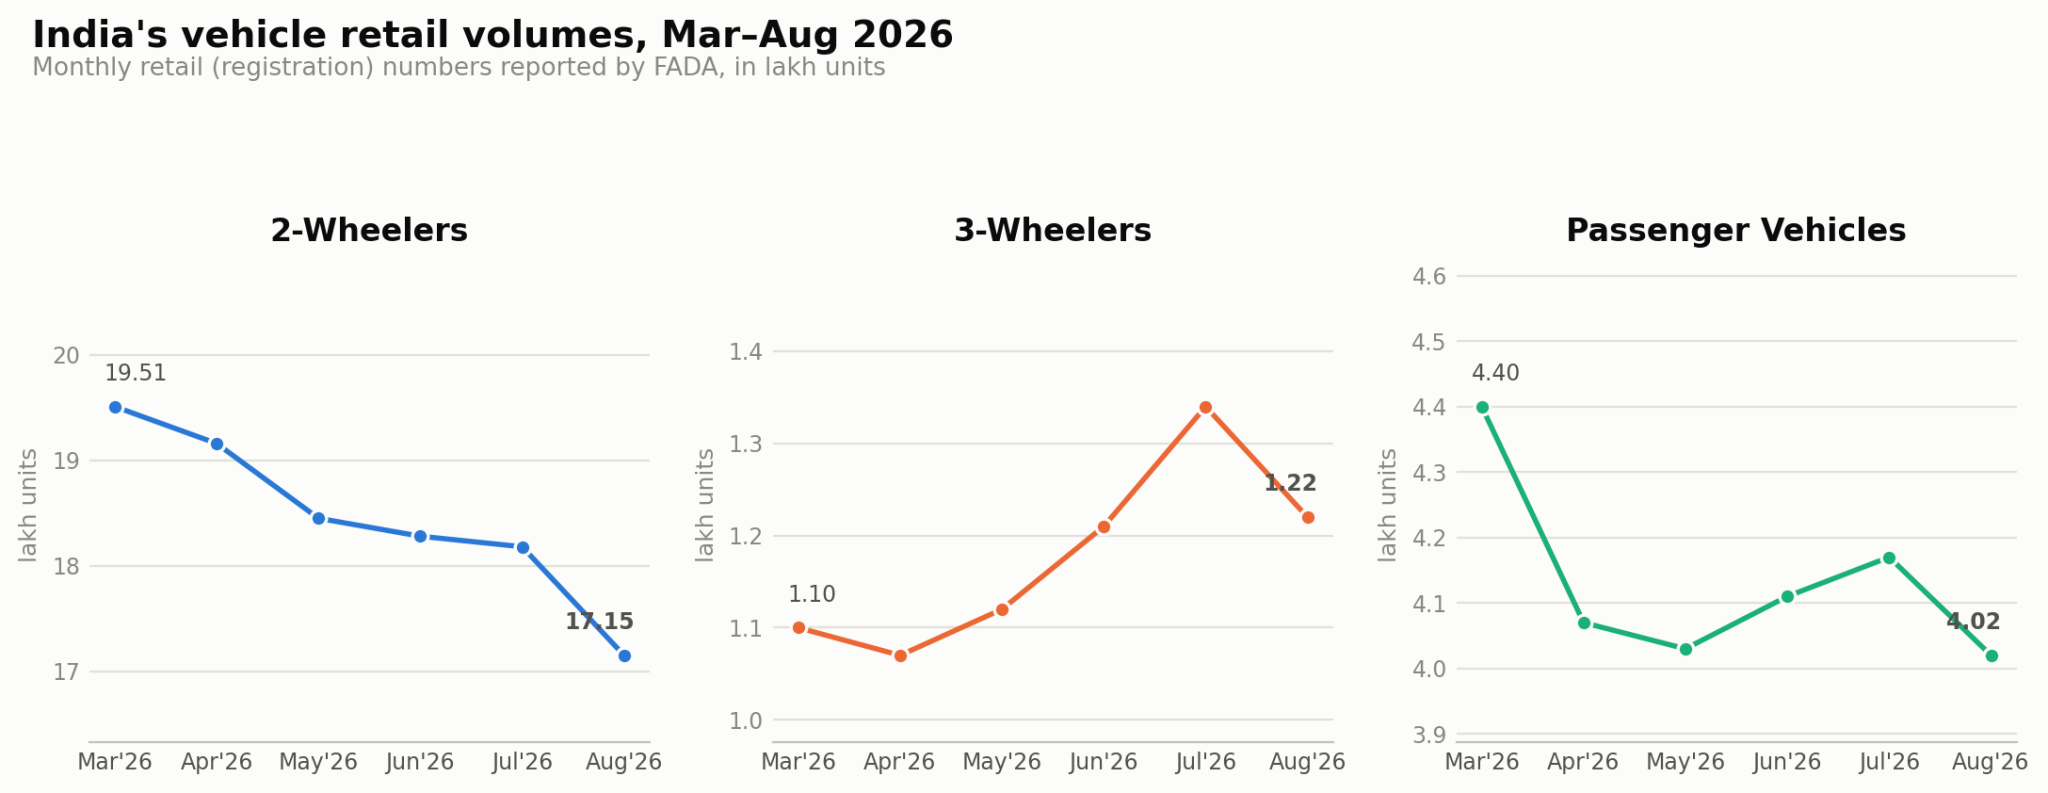
Two-wheelers are by far the largest category — 17.1 lakh units in August 2026 alone, versus roughly 1.2 lakh three-wheelers and 4 lakh passenger vehicles in the same month. The 2W trend line has been gently sliding down since March’s 19.51 lakh units, which was itself an unusually strong month — FADA’s own release called it the highest-ever March on record, likely helped by year-end dealer push and buyer discounts before the fiscal close.
Three-wheelers show the opposite shape: a dip in April to 1.07 lakh units, then a steady climb to a six-month high of 1.34 lakh units in July, before easing back in August. Passenger vehicles bounced around a narrower band all six months, staying close to the 4-lakh mark.
The MoM dip isn’t the real story — the YoY growth is
Month-on-month numbers move around for boring, predictable reasons: festivals, monsoon timing, fiscal year-end pushes. The more useful comparison is year-on-year, because it strips out most of that seasonal noise.
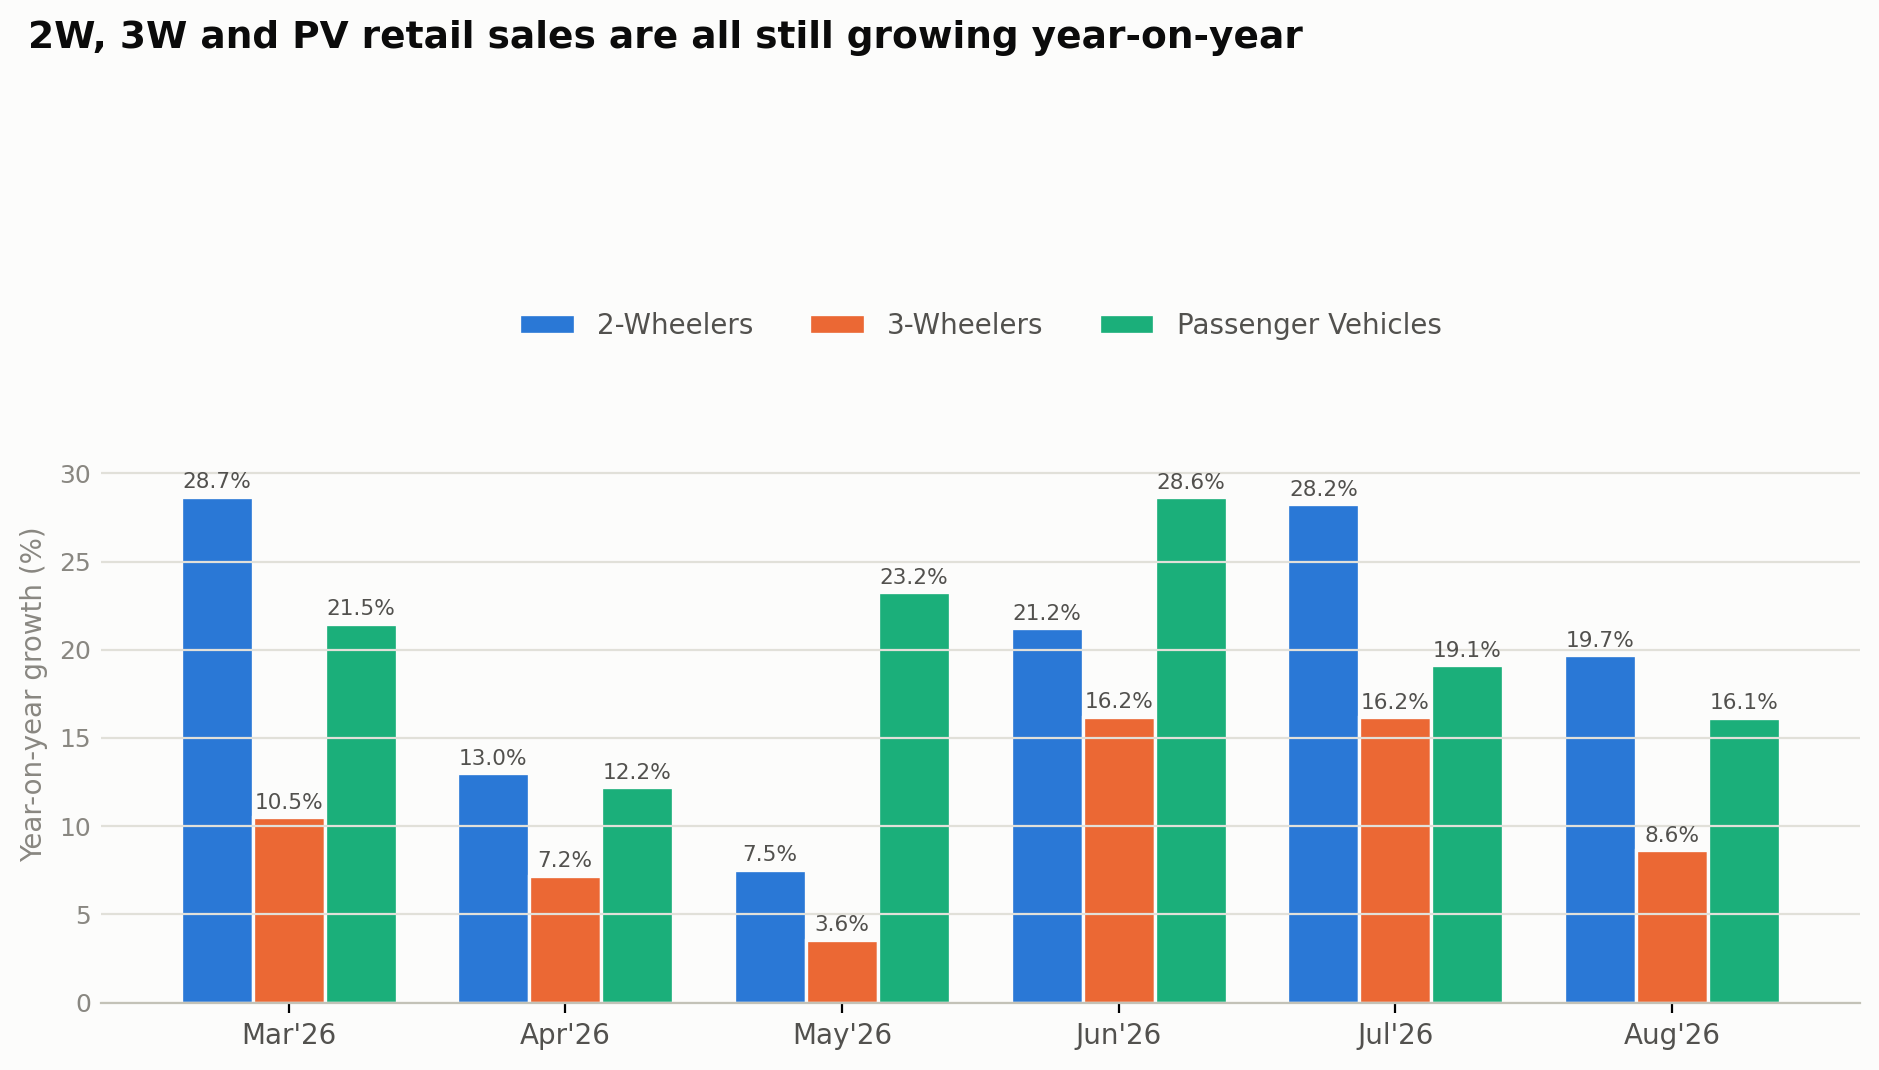
On that basis, every single month from March to August 2026 posted double-digit YoY growth for two-wheelers and passenger vehicles, and FADA repeatedly flagged these as record months for their calendar slot: April was called the industry’s highest-ever April, June was described as the best June ever recorded, July as the best-ever July, and August as the biggest-ever August in the Vahan series. Three-wheelers grew more modestly, ranging from 3.56% in May to 16.20% in June, but never turned negative. Read the two charts together and the picture is one of a market that dips a little most months but is still meaningfully bigger than it was a year ago.
How to use FADA vehicle retail data yourself
A few habits make this data more useful. Always check both MoM and YoY together — a scary-looking monthly drop can simply be a normal comedown from an unusually strong month before it (as with 2W after March 2026’s record). Track your specific sub-category, since “3W” bundles e-rickshaws, goods carriers and passenger three-wheelers, and they can move in different directions in the same month. And keep an eye on the commentary line in each release — FADA’s dealers often flag rural-versus-urban demand splits and inventory conditions that the raw numbers alone won’t show you.
This article is for information and educational purposes only, and is not investment advice. Figures are sourced from FADA’s official monthly releases as published; any errors in summarizing them are the author’s own, and readers should verify against the original PDFs linked above before relying on these numbers for decisions.
Key takeaways
- What it measures: FADA publishes its monthly vehicle retail data free on fada.in, usually within the first few days of the following month, as a PDF table with month-on-month and year-on-year changes. It comes from the government’s Vahan registration database, so it reflects what buyers actually took home, not wholesale dispatches to dealers.
- What the last six months show: In August 2026, retail volumes were 17.1 lakh two-wheelers, roughly 1.2 lakh three-wheelers and about 4 lakh passenger vehicles. Every month from March to August 2026 posted double-digit year-on-year growth for two-wheelers and passenger vehicles.
- How to read it: Check month-on-month and year-on-year together, because a monthly drop can be a normal comedown after a strong month, as with two-wheelers after March 2026’s record. Track your own sub-category too, since three-wheelers bundle e-rickshaws, goods carriers and passenger three-wheelers.
Frequently asked questions
FADA (Federation of Automobile Dealers Associations) is the apex body of India’s automobile retail trade. It was founded in 1964 and represents over 15,000 dealerships across more than 30,000 outlets, in an industry that employs close to 5 million people at dealerships and service centres.
A lot of auto sales news is wholesale data, meaning vehicles dispatched from factories to dealer showrooms. FADA’s retail data comes from the government’s Vahan vehicle-registration database, so it reflects what buyers actually took home. FADA has long argued that wholesale numbers can overstate real demand.
FADA publishes it as a short press release on fada.in, usually within the first few days of the following month. Each release is a downloadable PDF with one summary table covering every vehicle category, with month-on-month and year-on-year changes already calculated. There is no login, subscription or paywall.
Two-wheelers were the largest category at 17.1 lakh units in August 2026, after a 19.51 lakh March that FADA called the highest-ever March. Three-wheelers reached a six-month high of 1.34 lakh units in July, and passenger vehicles stayed close to the 4-lakh mark. Two-wheelers and passenger vehicles posted double-digit year-on-year growth in every month.
Sources
Main sources
FADA Releases August 2026 Vehicle Retail Data
FADA Releases July 2026 Vehicle Retail Data
FADA Releases June 2026 Vehicle Retail Data
FADA Releases May 2026 Vehicle Retail Data
FADA Releases April 2026 Vehicle Retail Data
FADA Releases FY 2026 and March 2026 Vehicle Retail Data
Other sources
I used Claude, an AI assistant, to rephrase my notes to make it reader friendly.