

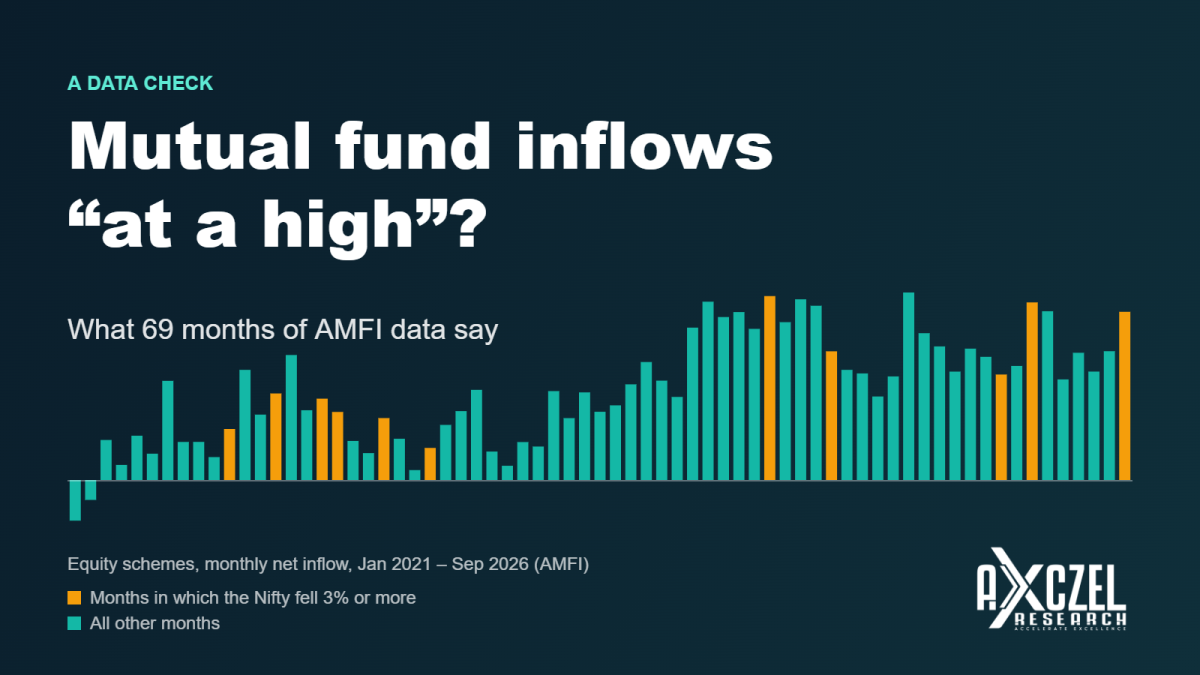
A headline says money is pouring into mutual funds even as the market falls. It is a nice story. But how do we know it is true?
You do not have to take anyone’s word for it. AMFI publishes the numbers for free, every month. This article shows where to find them, how to read them, and what they say when I lined up 69 months of them. It also shows what happened to mutual fund inflows in the months when the Nifty (India’s main stock market index) fell the most.
We have also written about how to analyze a mutual fund’s performance for free. This article is different. It is about how much money people put in, not how well a fund performed.
Where this post comes from: I read a Reuters report with the headline “India’s monthly fund investments hit record highs despite market slide”. I then checked the AMFI site, and the figures on mutual fund inflows below come from the monthly reports that AMFI (the Association of Mutual Funds in India) publishes on its AMFI Data page. I downloaded the Excel file for each month from January 2021 to September 2026, 69 files in all. There is no public link to my combined table, so I name the source files here instead. The Nifty’s monthly changes come from its monthly closing values, which I took from a monthly Nifty 50 price file.
Where to find mutual fund inflows data on AMFI
Open the AMFI Data page and choose AMFI Monthly Data. You will see a list of financial years (April to March). Open a year and each month has two download links: PDF and Excel.
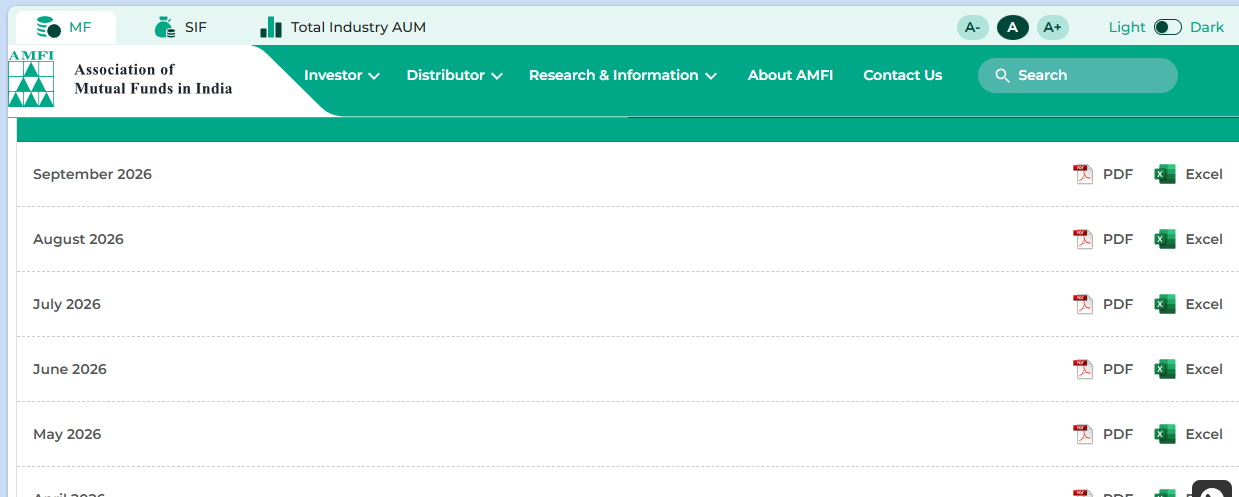
I use the Excel file. It has two worksheets:
Worksheet 1 (the main report): the number of schemes, the number of folios, money collected, money withdrawn, the net inflow or outflow, and the total assets, for every fund category.
Worksheet 2 (NSR): the new schemes launched during the month. It has four columns: type and category, name of the scheme, number of schemes, and funds mobilized. The September 2026 file lists 28 new schemes. If you track new fund launches (NFOs), this is the sheet to read. It shows which fund houses launched what, and how much each new scheme collected.
This article uses only Worksheet 1.
How to read the monthly report
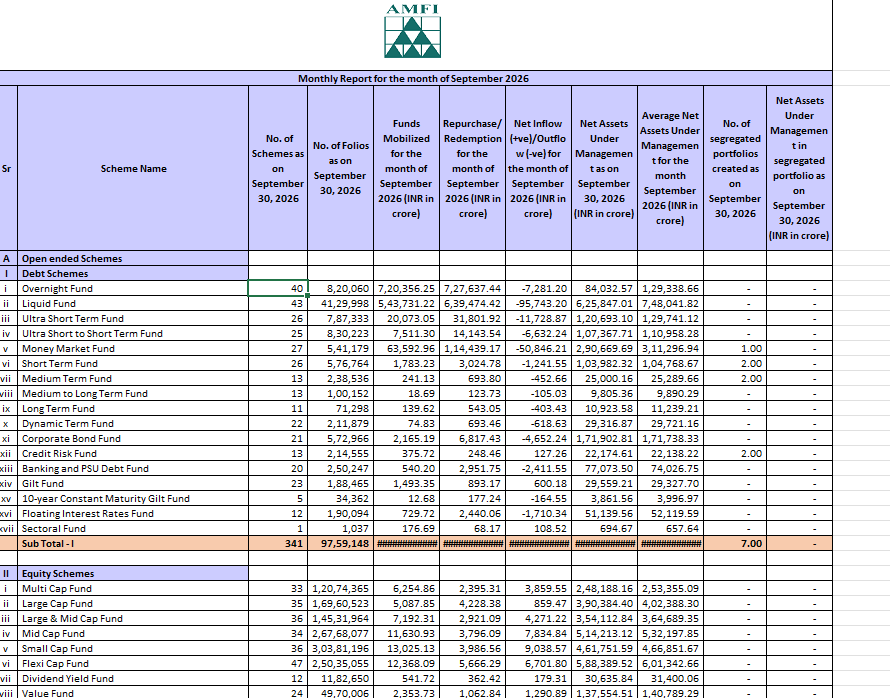
The columns that matter:
No. of Folios: the number of investor accounts. One person can hold many folios, so this is not the number of people.
Funds Mobilized: fresh money put in during the month.
Repurchase/Redemption: money taken out during the month.
Net Inflow (+ve) / Outflow (-ve): money put in minus money taken out. This is the number to watch.
Three things to know before you start:
1. Open-ended schemes. These let you buy or sell on any business day, and monthly SIPs (systematic investment plans) work only in them. They make up most of the industry, so I looked only at them. Close-ended and interval schemes are left out.
2. Subtotals. Each group has a subtotal row: Debt Schemes (Sub Total I), Equity Schemes (Sub Total II) and Hybrid Schemes (Sub Total III). I used those rows. Older files call the equity group “Growth/Equity Oriented Schemes”; I treated it as the same thing as today’s “Equity Schemes”.
3. The report does not show SIPs separately. It shows all new money together, whether it came from SIPs or lump sums.
I also checked the data. In all 69 months, funds mobilized minus redemptions equals the net inflow for each of the three groups.
One more note. The categories inside the equity group changed over the years. In January 2021 the equity group had 11 categories. By September 2026 it had 13, because some were split in two. For example, Value and Contra funds, and Sectoral and Thematic funds, were once shown together. So the older and newer numbers are close cousins, not perfect twins.
What the mutual fund inflows data shows
Equity schemes: inflows almost every month
Equity schemes had a net inflow in 67 of the 69 months. The only two months with a net outflow were January and February 2021.
Adding up the net inflow by calendar year (in ₹ crore, from the AMFI monthly reports):
| Year | Equity net inflow (₹ crore) |
|---|---|
| 2021 | 96,676 |
| 2022 | 161,044 |
| 2023 | 161,578 |
| 2024 | 394,260 |
| 2025 | 350,152 |
| 2026 (January to September) | 273,111 |
The jump in 2024 is clear in the chart below. In the last 12 months (October 2025 to September 2026) the equity net inflow was ₹355,766 crore, against ₹386,483 crore in the 12 months before that.
The highest single month in these 69 was July 2025, at ₹42,702 crore. AMFI’s own monthly note for July 2025 calls it the highest-ever monthly inflow into equity funds, and Business Standard reported the same figure as a record. No month since then has been higher.
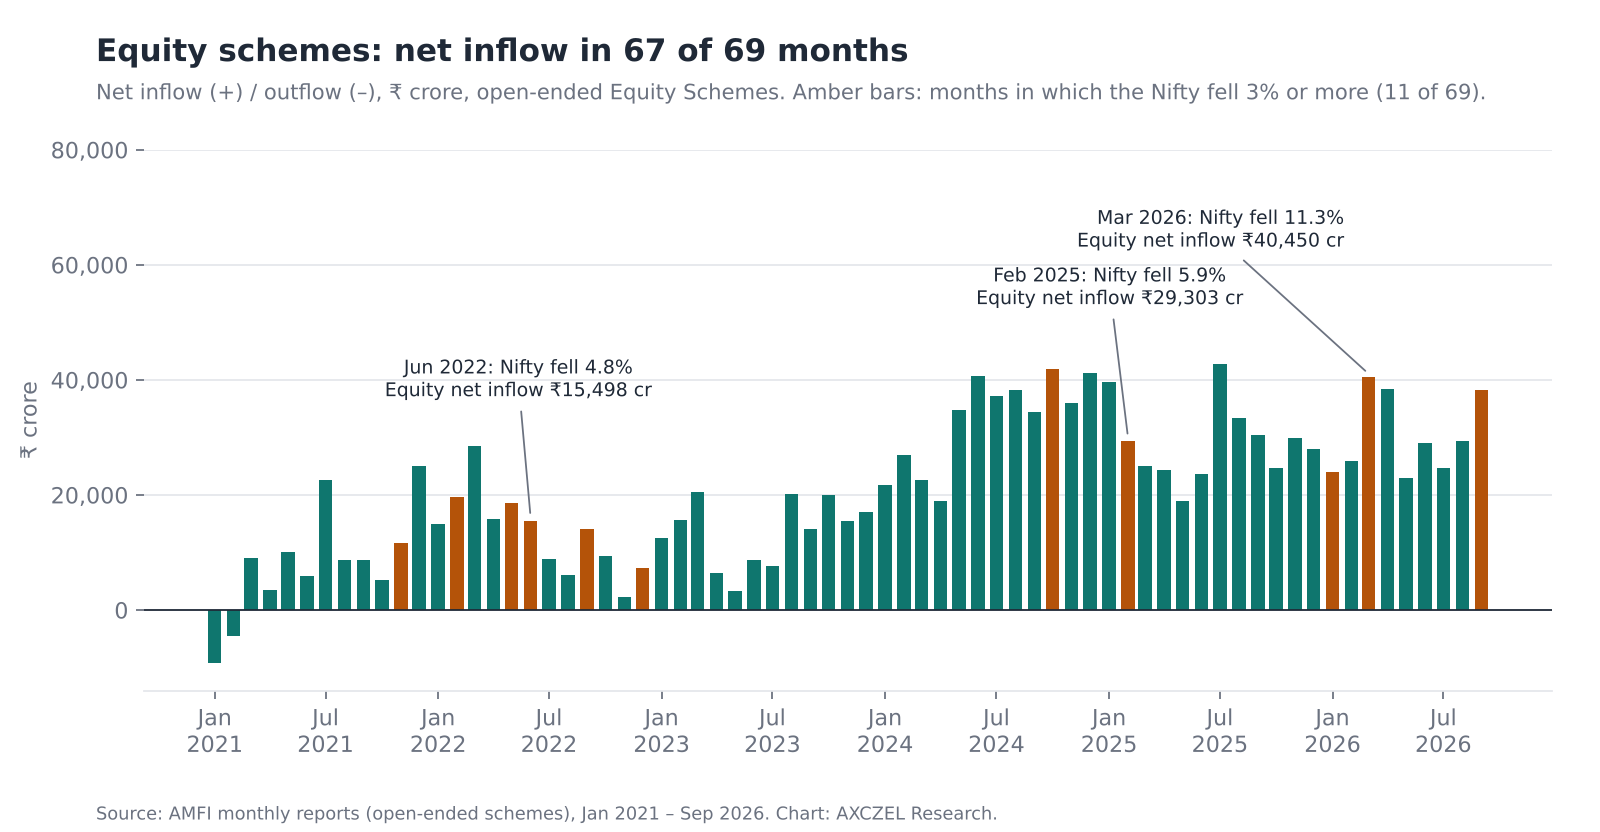
A note on the headline. September 2026 shows a net equity inflow of ₹38,307 crore, which is 30.6% more than August’s ₹29,329 crore. That is a real rise. But in this equity subtotal, September is below July 2025, March 2026 (₹40,450 crore) and April 2026 (₹38,440 crore). The headline may use a different measure from the equity subtotal I used. This is the reason to check the source yourself.
Folios: equity accounts almost tripled
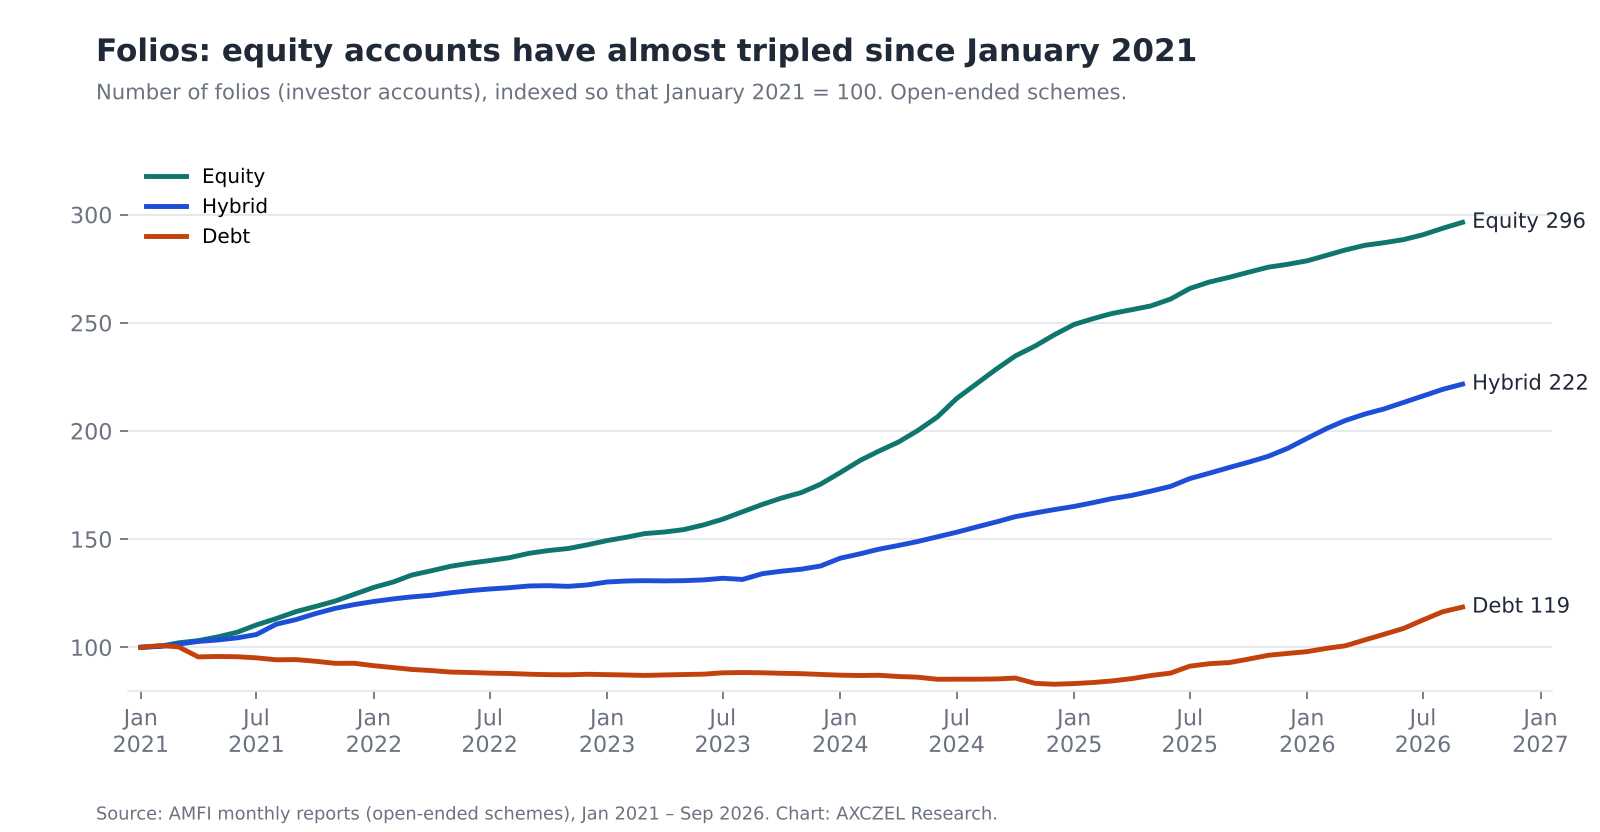
Folios tell a slower, steadier story than the monthly flows.
| Folios (open-ended) | Jan 2021 | Sep 2026 | Change |
|---|---|---|---|
| Equity schemes | 64.4 million | 191.0 million | about 3.0 times |
| Hybrid schemes | 9.3 million | 20.6 million | about 2.2 times |
| Debt schemes | 8.2 million | 9.8 million | about 1.2 times |
Equity folios rose from 64,424,084 in January 2021 to 190,990,944 in September 2026. They grew in every one of those months. Debt folios first fell, to about 6.8 million in December 2024, and have risen since.
Debt and hybrid schemes: the swings are much bigger
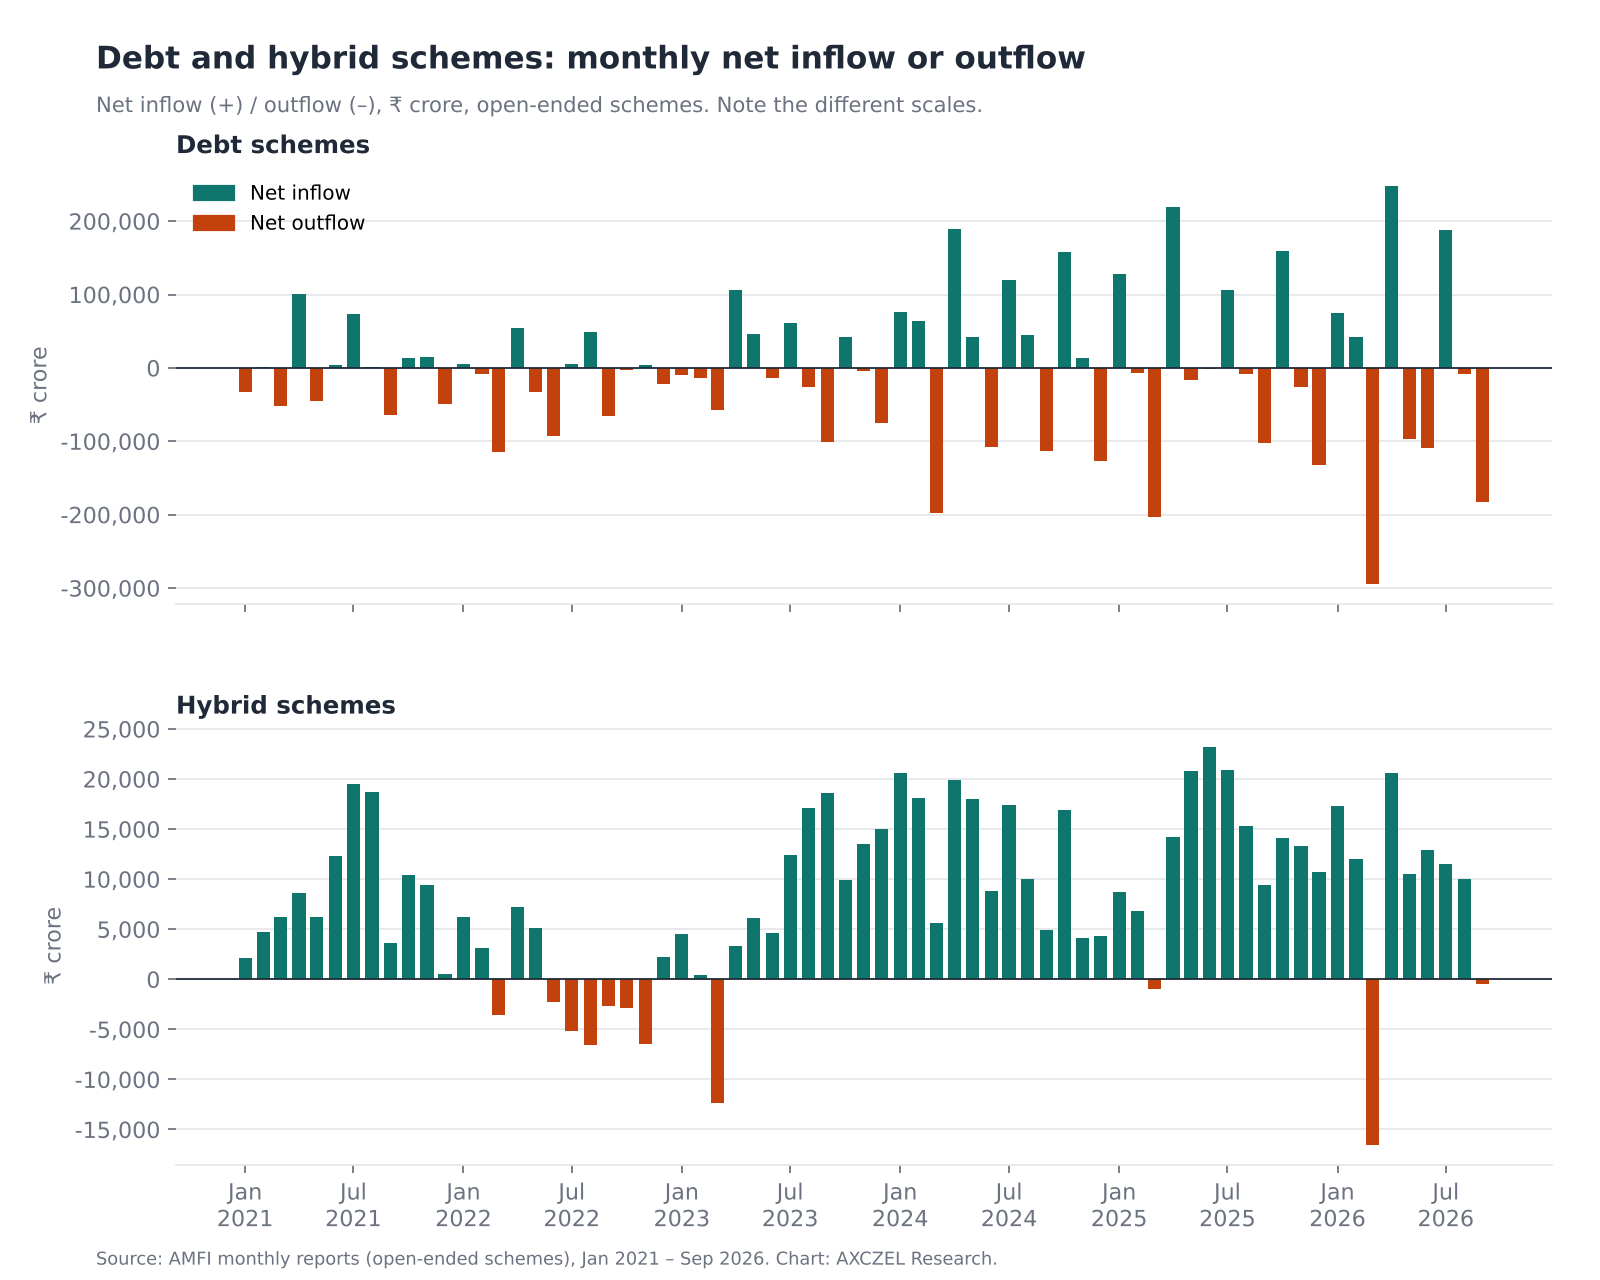
Debt schemes behave very differently. Their monthly net flow jumps between big inflows and big outflows. September 2026 shows a net outflow of ₹183,156 crore from debt schemes, and March 2026 shows ₹294,987 crore going out.
There is a clear calendar pattern. Debt schemes had a net outflow in 22 of the 23 quarter-end months (March, June, September and December). In the other 46 months, they had an outflow in 15. The AMFI report does not give reasons for this, so I only note the pattern. What it does mean is that a “total industry” number can swing mostly because of debt. In September 2026, for example, the total net flow into open-ended schemes was an outflow of ₹133,060 crore, while equity schemes had an inflow of ₹38,307 crore.
Hybrid schemes (funds that mix equity, debt and other assets) were mostly positive too, with 11 months of net outflow. Seven of those fall between March and November 2022. The others are March 2023, March 2025, March 2026 and September 2026.
Mutual fund inflows when the market falls
To test the headline, I also looked at the Nifty. I used the Nifty 50’s monthly closing values from a monthly data file I hold, and worked out the percentage change from one month-end to the next. Then I picked every month in which the Nifty fell 3% or more. There are 11 such months among the 69. The 3% line is my own choice. I show only percentage changes, not index levels. Please note that the inflow figures are not SIP data. AMFI’s monthly report does not show SIPs separately, so each figure includes SIPs and lump sums together, and we do not know how much of it is SIP.
| Month | Nifty change | Equity net inflow | Month before | Change in inflow |
|---|---|---|---|---|
| November 2021 | -3.9% | ₹11,615 crore | ₹5,215 crore | +123% |
| February 2022 | -3.1% | ₹19,705 crore | ₹14,888 crore | +32% |
| May 2022 | -3.0% | ₹18,529 crore | ₹15,890 crore | +17% |
| June 2022 | -4.8% | ₹15,498 crore | ₹18,529 crore | -16% |
| September 2022 | -3.7% | ₹14,100 crore | ₹6,120 crore | +130% |
| December 2022 | -3.5% | ₹7,303 crore | ₹2,258 crore | +223% |
| October 2024 | -6.2% | ₹41,887 crore | ₹34,419 crore | +22% |
| February 2025 | -5.9% | ₹29,303 crore | ₹39,688 crore | -26% |
| January 2026 | -3.1% | ₹24,029 crore | ₹28,054 crore | -14% |
| March 2026 | -11.3% | ₹40,450 crore | ₹25,978 crore | +56% |
| September 2026 | -6.1% | ₹38,307 crore | ₹29,329 crore | +31% |
What the table shows: in 8 of the 11 months, the equity net inflow was higher than in the month before. In 3 it was lower: June 2022, February 2025 and January 2026. In all 11 months, equity schemes still had a net inflow, so investors as a group did not pull money out on a net basis.
For comparison, in the other 57 months that have a month before them (the Nifty rose, or fell by less than 3%), the equity net inflow was higher than the month before in 26, or about 46%.
Looking inside the numbers:
March 2026: the biggest fall, 11.3%, came with a 56% rise in equity net inflow. Funds mobilized rose to ₹83,776 crore from ₹62,076 crore in February. Redemptions also rose, to ₹43,325 crore from ₹36,098 crore. More money came in, and more went out.
September 2026: redemptions fell to ₹36,525 crore from ₹44,285 crore in August, while funds mobilized stayed almost flat (₹74,832 crore against ₹73,614 crore).
These are observations, not a rule. There are cases where inflows did not behave this way, as the table shows. Eleven months is a small sample. Inflows also rose strongly between 2021 and 2024, which makes a rise from one month to the next more likely. The Nifty’s change and the inflow are both for the same month, so we cannot tell which came first. And the report does not separate SIPs, which come in on schedule whatever the market does.
How to check mutual fund inflows yourself
1. Download the monthly Excel files from the AMFI Data page.
2. In Worksheet 1, find the subtotal rows for Debt, Equity and Hybrid schemes.
3. Note the folios and the Net Inflow column for each month.
4. Add the Nifty’s monthly closing values (from a charting site or NSE’s index data), and work out each month’s percentage change. Then put the months side by side and look for patterns, for example in months when the market fell.
Keep the same rows from month to month, and remember that category names and counts change over time.
This article is for information only and is not investment advice. Figures may change, and any mistakes in summarising the data are mine.
Key takeaways
- What the data is: AMFI publishes a free monthly Excel report with folios, money collected, money withdrawn and net inflow for every fund category, on its AMFI Data page.
- What it shows for equity: Equity schemes had a net inflow in 67 of 69 months from January 2021 to September 2026, and equity folios grew about three times.
- Why debt confuses the totals: Debt schemes swing between large inflows and outflows, with an outflow in 22 of 23 quarter-end months, so look at each group separately.
- What happened when the market fell: In the 11 months when the Nifty fell 3% or more, equity net inflow was higher than the month before in 8 and lower in 3. It stayed positive in all 11. These are observations, not a rule.
- What it cannot show: The report does not split SIPs from lump sums, and folios are accounts, not people.
Frequently asked questions
AMFI publishes it for free on its AMFI Data page, as a PDF and an Excel file for each month.
It is the money put into a category during the month minus the money taken out. A negative number is a net outflow.
A folio is an investor account with a fund house. One person can have several, so folios are not the same as the number of investors.
Not separately. The monthly report shows all new money together. You cannot split SIPs from lump sums in it.
Open the monthly Excel file from the AMFI Data page and go to the second worksheet, NSR. It lists the new schemes launched that month, grouped by category, with the funds each one collected. The September 2026 file lists 28 new schemes.
In the 11 months when the Nifty fell 3% or more, equity net inflow was higher than the month before in 8 and lower in 3, and it stayed positive in all 11. That is a small sample, so it is an observation, not a rule.
Sources
Main sources
AMFI, monthly reports (Excel, Worksheet 1) for January 2021 to September 2026, downloaded from the AMFI Data page. There is no public link to the combined table built from these files.
Other sources
Reuters, “India’s monthly fund investments hit record highs despite market slide”, 12 October 2026.
Nifty 50 monthly closing values: the author’s own monthly data file for the index (NSE_NIFTY, monthly). There is no public link to the file.
AMFI, AMFI Monthly Note, July 2025 (July 2025 equity inflow and “highest-ever” description).
Business Standard, “Mutual Fund boom: Equity inflows surge 81%, debt sees ₹1 lakh cr turnaround”, 11 August 2025 (July 2025 equity inflow reported as a record).
Outlook Money, “AMFI data September 2026: equity MF inflows 38,307 crore rupees” (cross-check of the September 2026 equity figure).
AXCZEL Insights, “Anyone Can Analyze a Mutual Fund: Here’s How, for Free”.
I used Claude, an AI assistant, to rephrase my notes to make it reader friendly.