
Latest Articles
In-depth financial analysis, market commentary, and expert perspectives from our senior editorial team.
 Policy
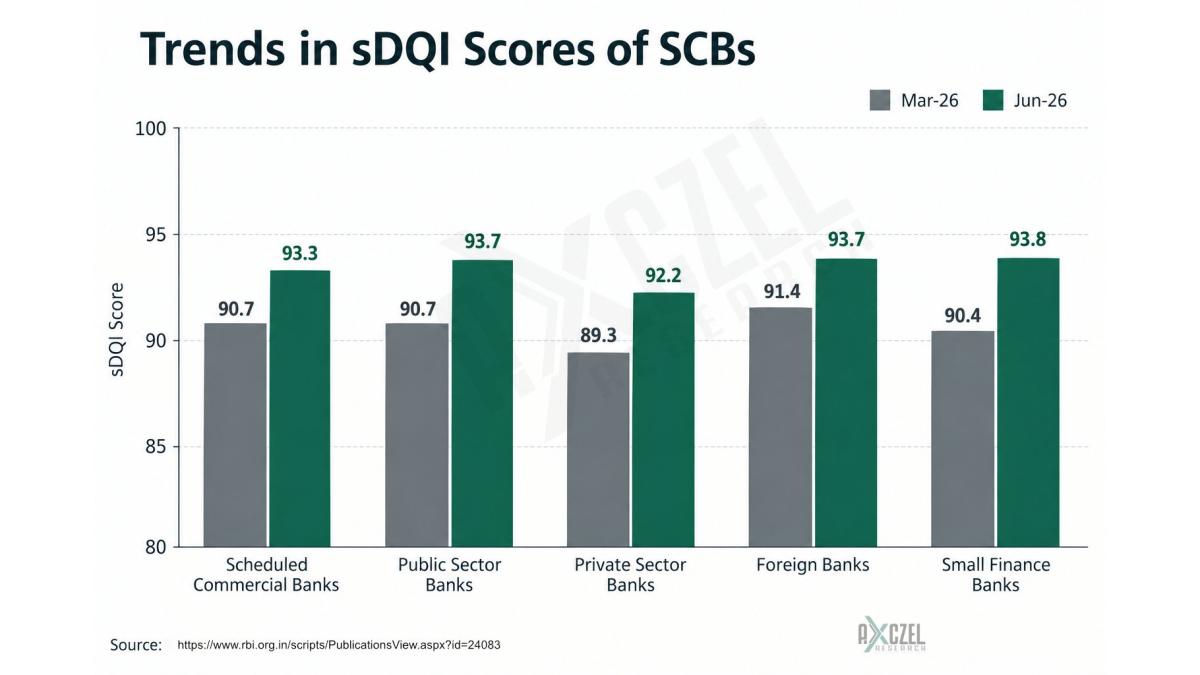
Banks Are Getting Better at Telling the RBI the Truth — Here’s Why That Should Matter to You
RBI's Supervisory Data Quality Index for banks rose to 93.3 in June 2026, its best score yet. Here's what the sDQI measures, what changed, and why it matters for your deposits.
 Finance
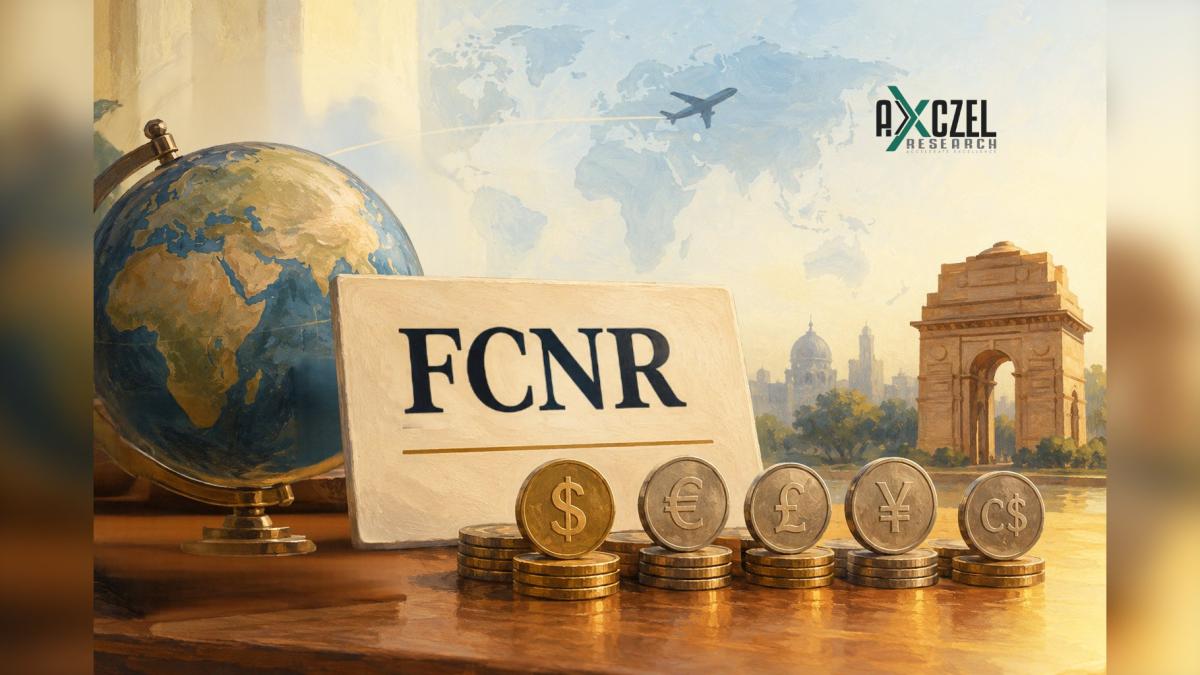
FCNR Explained: Why the RBI Wants NRIs’ Dollars
A plain-English guide to FCNR deposits, why the RBI pushed them in 2026, how banks collected about $133 billion, and what banks will do with the money.
 Analysis
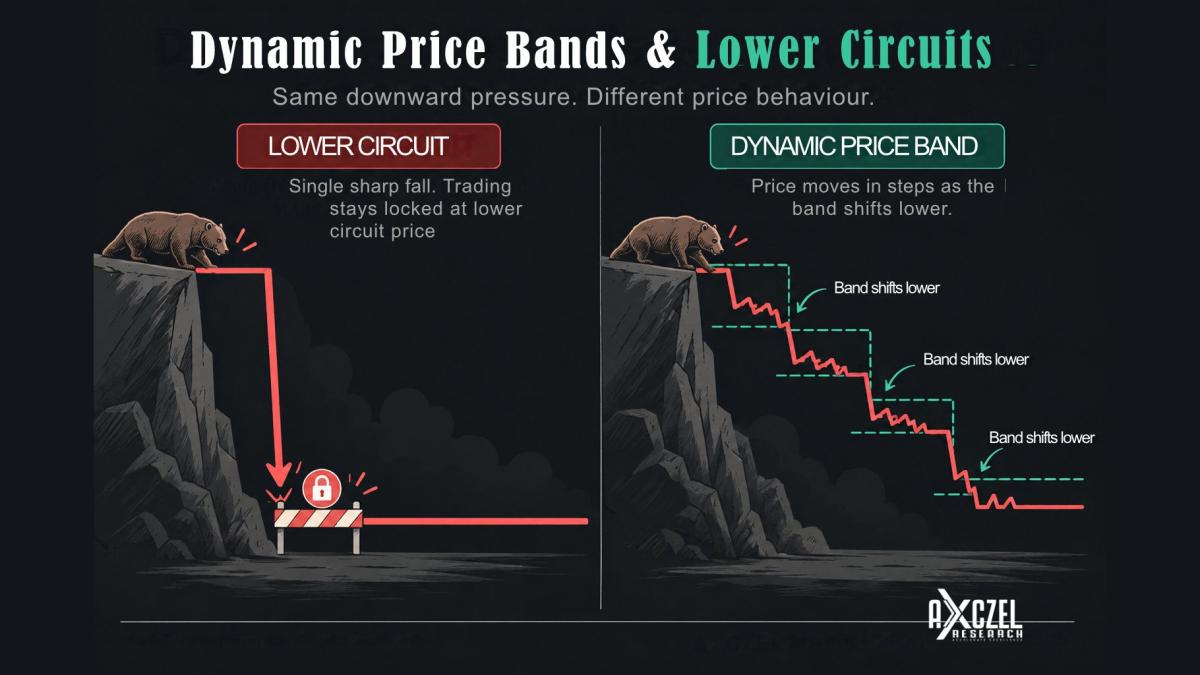
One Stock Froze, the Other Kept Sliding: How Circuit Limits Really Work
Why did one stock freeze at its lower circuit while another kept falling in steps? A plain-English look at fixed price bands, dynamic price bands and what a circuit limit can and cannot do.
 Policy
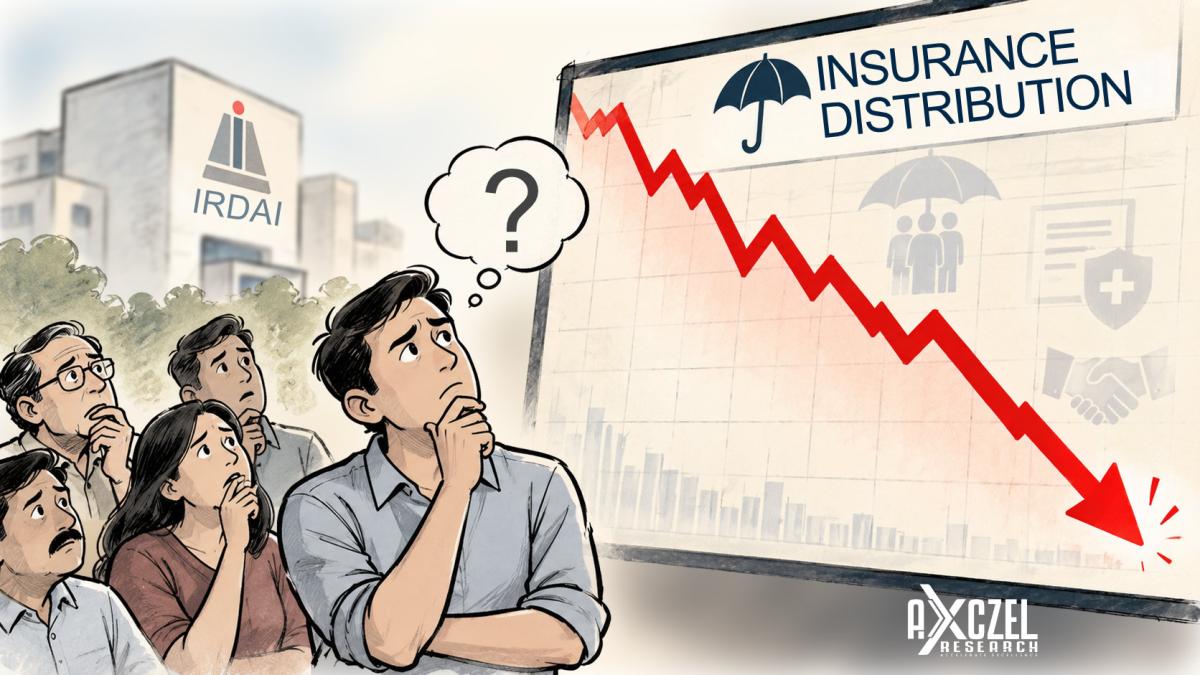
IRDAI Consultation Paper: A Quick Takeaway for You and Me
IRDAI has proposed sweeping changes to how insurance is sold in India, sending PB Fintech and Turtlemint shares tumbling. Here's a plain-English look at what the consultation paper proposes and what it could mean for you.
 Analysis
One Format, Two Exchanges: How UDiFF and ISIN Make NSE vs BSE Comparison Easy
NSE and BSE now publish their daily bhavcopy in one common format called UDiFF. Add the ISIN, a unique code for every security, and comparing the same stock across both exchanges becomes simple.
 Analysis
Cement Is Booming, Coal Isn’t: What India’s Core Industries Data Just Revealed
India's Index of Core Industries grew 4.8% in August 2026, a touch below July's 5.0%. Behind that headline: cement, electricity and steel are booming on the capex cycle, while coal, natural gas, crude oil and fertilizers are shrinking — plus, does India even produce its own crude oil?
 Analysis
Anyone Can Analyze a Mutual Fund: Here’s How, for Free
Choosing a mutual fund is easier than it looks. Here is how to use AMFI’s free Fund Performance page to compare funds, understand the categories and check them against their benchmarks.